AUDUSD 1H Technical Outlook – Wednesday, 26 February 2026: Multi-Year Resistance Meets Intraday Structure Shift
Thu Feb 26 2026
More analysis for this pair:
View all AUDUSD market analysis →Forex forecast for this pair:
View AUDUSD forecast →Market Context
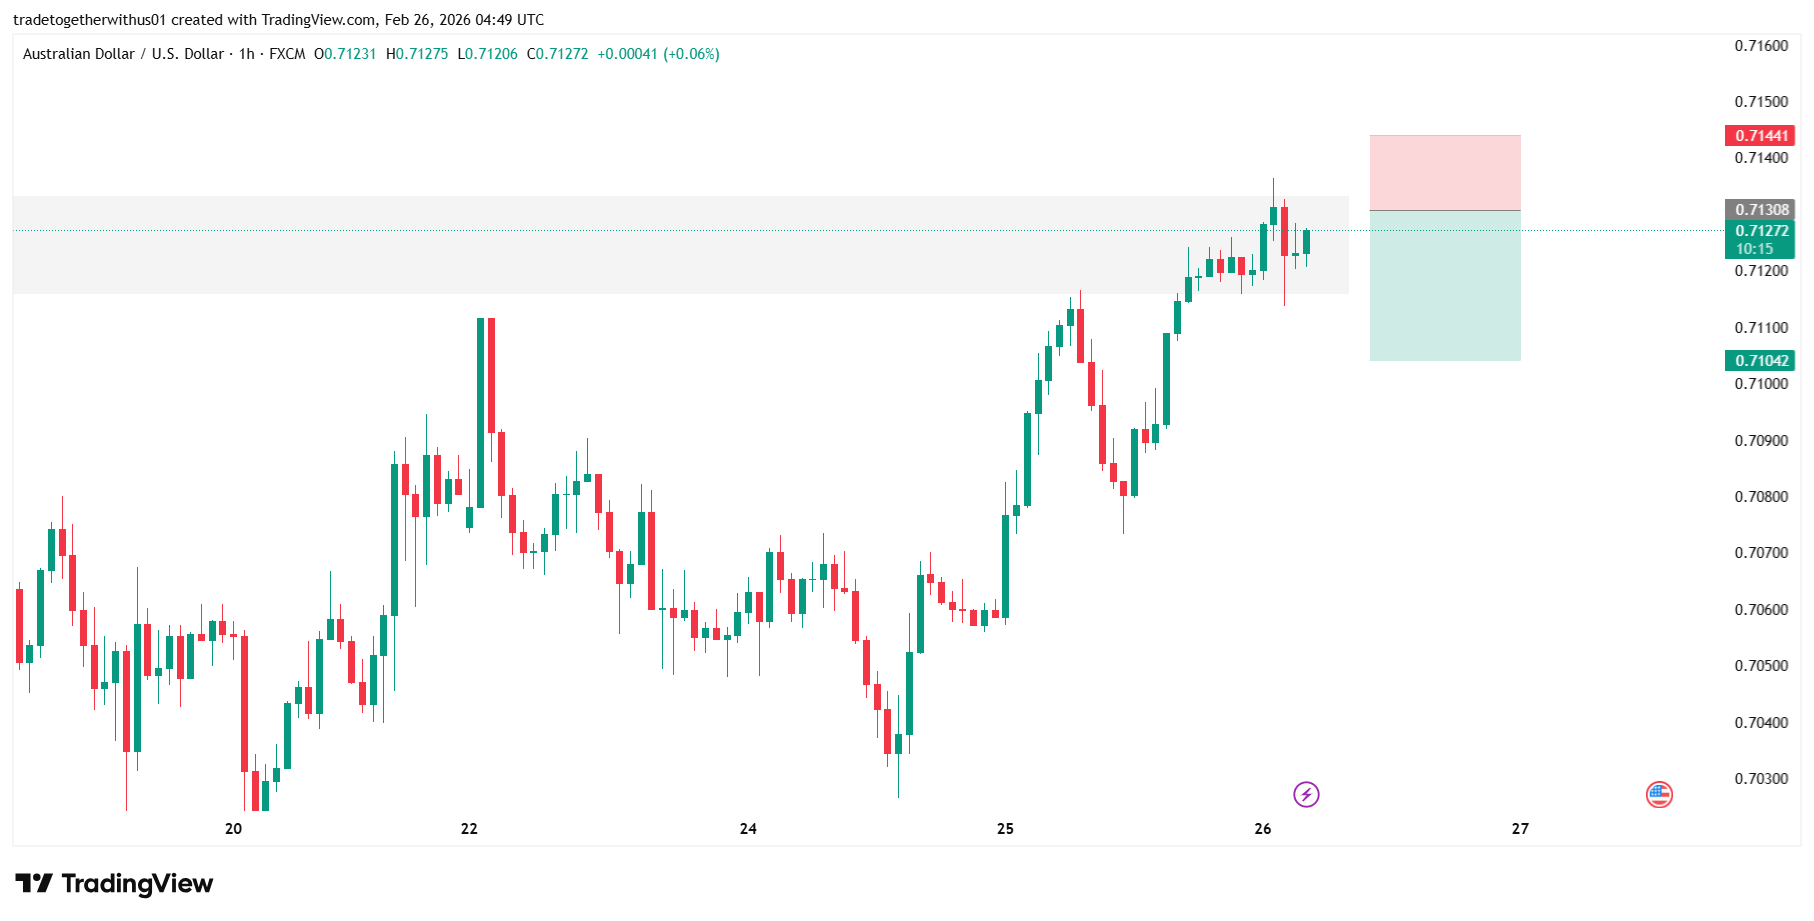
As of Wednesday, 26 February 2026, AUD/USD is trading near 0.71262, positioning the pair directly beneath a historically reactive resistance band around 0.71364 – 0.71441.
This zone has capped advances in prior cycles, including reactions visible in 2023 and 2024. The current test occurs within a short-term bullish sequence on the one-hour timeframe, creating a technically significant decision area where higher-timeframe supply meets local upward momentum.
Higher Timeframe Structure (4H Perspective)
On the 4-hour chart, AUD/USD has recovered from the broader base near 0.69546, forming a constructive medium-term structure.
However, the advance is now approaching a well-defined resistance cluster:
- Primary resistance: 0.71364 – 0.71441
- Intermediate support: 0.71042
- Secondary support band: 0.70754 – 0.70668
- Lower structural support: 0.70317 – 0.70207
The resistance band aligns with prior distribution phases and liquidity concentrations. Historically, similar tests have produced rotational pullbacks rather than immediate continuation. While historical reactions do not determine future outcomes, repeated interactions enhance the structural relevance of this area.
One-Hour Chart Structure and Key Observations
The 1H timeframe continues to reflect a sequence of higher highs and higher lows, consistent with short-term bullish order flow.
Key technical observations:
- Price has extended into prior order block territory near 0.71308 – 0.71441.
- Upward momentum shows early signs of deceleration as candles print smaller real bodies near resistance.
- Intraday wicks suggest responsiveness to overhead liquidity.
This configuration presents a structural tension:
- Short-term trend alignment
- versus
- Higher-timeframe supply compression
Such conditions often precede either breakout acceleration or rotational rebalancing.
Intraday Momentum Shift (5-Minute Structure)
On the 5-minute timeframe, a clear Change of Character (ChoCh) has formed following the resistance reaction.
This intraday development reflects:
- A minor break in short-term bullish structure
- Failure to extend beyond immediate liquidity above local highs
- Early signs of distribution beneath resistance
Lower-timeframe structural shifts frequently act as leading indicators. However, they require confirmation on execution timeframes before altering broader structural bias.
Educational Interpretation of the Marked Structural Zones
The highlighted zones represent structural decision areas rather than directional guidance.
Upper Structural Band (0.71364 – 0.71441)
This region reflects:
- Multi-year reaction history
- Prior distribution and supply behavior
- Resting liquidity above recent highs
- Compression of short-term bullish expansion
Sustained acceptance above this band would suggest supply absorption. Continued rejection would reinforce its structural ceiling characteristics.
Mid-Range Structural Area (Around 0.71042)
This level represents:
- Immediate support within the current 1H trend
- A potential rebalancing zone if resistance holds
- A reference point for evaluating continuation versus rotation
Lower Support Cluster (0.70754 – 0.70668)
This band aligns with:
- Prior consolidation range
- Liquidity resting below recent higher lows
- Potential structural equilibrium if broader pullback develops
Alternative Market Scenarios
1️⃣ Continuation Scenario
If AUD/USD establishes sustained acceptance above 0.71441, it would indicate:
- Absorption of higher-timeframe supply
- Structural breakout confirmation
- Potential transition toward higher liquidity zones
In this case, the prevailing one-hour uptrend would remain structurally intact.
2️⃣ Rotational Pullback Scenario
If the resistance band continues to cap price:
- Rotation toward 0.71042 becomes technically reasonable
- Deeper rebalancing toward 0.70754 – 0.70668 may unfold
- The 1H sequence could transition from expansion into consolidation
This outcome would align with the emerging 5-minute structure shift.
3️⃣ Consolidation Scenario
Price may compress between 0.71441 and 0.70754, forming a volatility contraction phase.
Such compression typically precedes directional expansion once liquidity accumulation completes.
What Market Participants Should Monitor Next
- Acceptance or rejection dynamics above 0.71441
- Evolution of 1H structure (continuation of higher highs versus formation of lower highs)
- Reaction behavior near 0.71042
- Volatility expansion characteristics following consolidation
Structure confirmation, rather than initial reaction, will define the next directional phase.
Learning Takeaway
This AUD/USD 1H setup illustrates a core principle of multi-timeframe technical analysis:
- Higher-timeframe resistance often supersedes lower-timeframe momentum.
- Intraday structure shifts frequently precede broader transitions.
- Historical liquidity zones retain relevance across market cycles.
- Structural confluence increases the probability of significant price response.
Regardless of directional outcome, this configuration provides a clear case study in aligning timeframes and evaluating decision zones objectively.
Explore more analysis from this trading session:
View all asia Session Analysis →Explore more forex forecasts and market outlooks:
View Forex Forecast Hub →Forex forecast for this session:
View AUDUSD asia Session Forecast →
Written by
Trade Together Research
Trade Together Research is a professional market analysis team providing forex, gold, and crypto trading insights, technical analysis, and educational guides.. Learn more about our research team on the About page.