BTCUSD Bitcoin Price Analysis – Tuesday, September 15, 2026
Tue Sep 15 2026
More analysis for this pair:
View all BTCUSD market analysis →Forex forecast for this pair:
View BTCUSD forecast →Bitcoin (BTCUSD) is showing a clear bearish structure after a strong rejection from a historically important resistance range on the 1-hour chart. The latest decline developed after several technical factors aligned around the same area, including repeated resistance, a change of character, an order-block reaction, a liquidity sweep, and lower-timeframe confirmation.
Market Context
On the 1-hour chart, Bitcoin repeatedly interacted with the 79,560–79,860 resistance range. The two orange levels mark an area where price had previously reached several times and experienced significant rejection.
Because the market repeatedly reacted from this region, the area became an important historical resistance zone rather than simply an isolated level.
During the latest approach, Bitcoin again failed to establish sustained acceptance above the range. Price subsequently reacted lower and produced a change of character, suggesting that the previous upward structure was beginning to weaken.
This provided the initial higher-timeframe bearish context for the analysis.
Technical Structure
Another important feature on the 1-hour chart was the identified order-block area around the green level. Instead of treating the entire order block equally, the analysis focused on its highest-volume area.
Price interacted with this region and produced a sweep before moving decisively lower. Following that reaction, Bitcoin began printing a sequence of large and continuous bearish candles.
The strength and continuity of the decline were important. Rather than seeing only a short-term rejection followed by immediate recovery, the market developed sustained downside momentum.
The analysis was then taken down to the 5-minute timeframe to determine whether the lower-timeframe structure supported the higher-timeframe interpretation.
Why This Market Scenario Was Considered
The bearish scenario developed through several connected observations.
First, Bitcoin approached the historically respected 79,560–79,860 resistance range, where previous attempts had resulted in strong rejection.
Second, the latest reaction from this area produced a change of character, indicating that the existing bullish structure was losing strength.
Third, price interacted with the identified order-block volume area and produced a sweep. The reaction from this region was followed by strong selling pressure and a series of bearish candles.
Finally, the 5-minute chart provided further confirmation through a developing sequence of bearish changes of character and breaks of structure.
This top-down approach was important because the analysis did not rely solely on resistance. The higher timeframe established the area of interest, while the lower timeframe was used to confirm that market structure had actually shifted.
Potential Market Scenarios
Bearish Scenario
The bearish interpretation remains relevant while Bitcoin continues to maintain the lower-high and lower-low structure visible on the 5-minute chart.
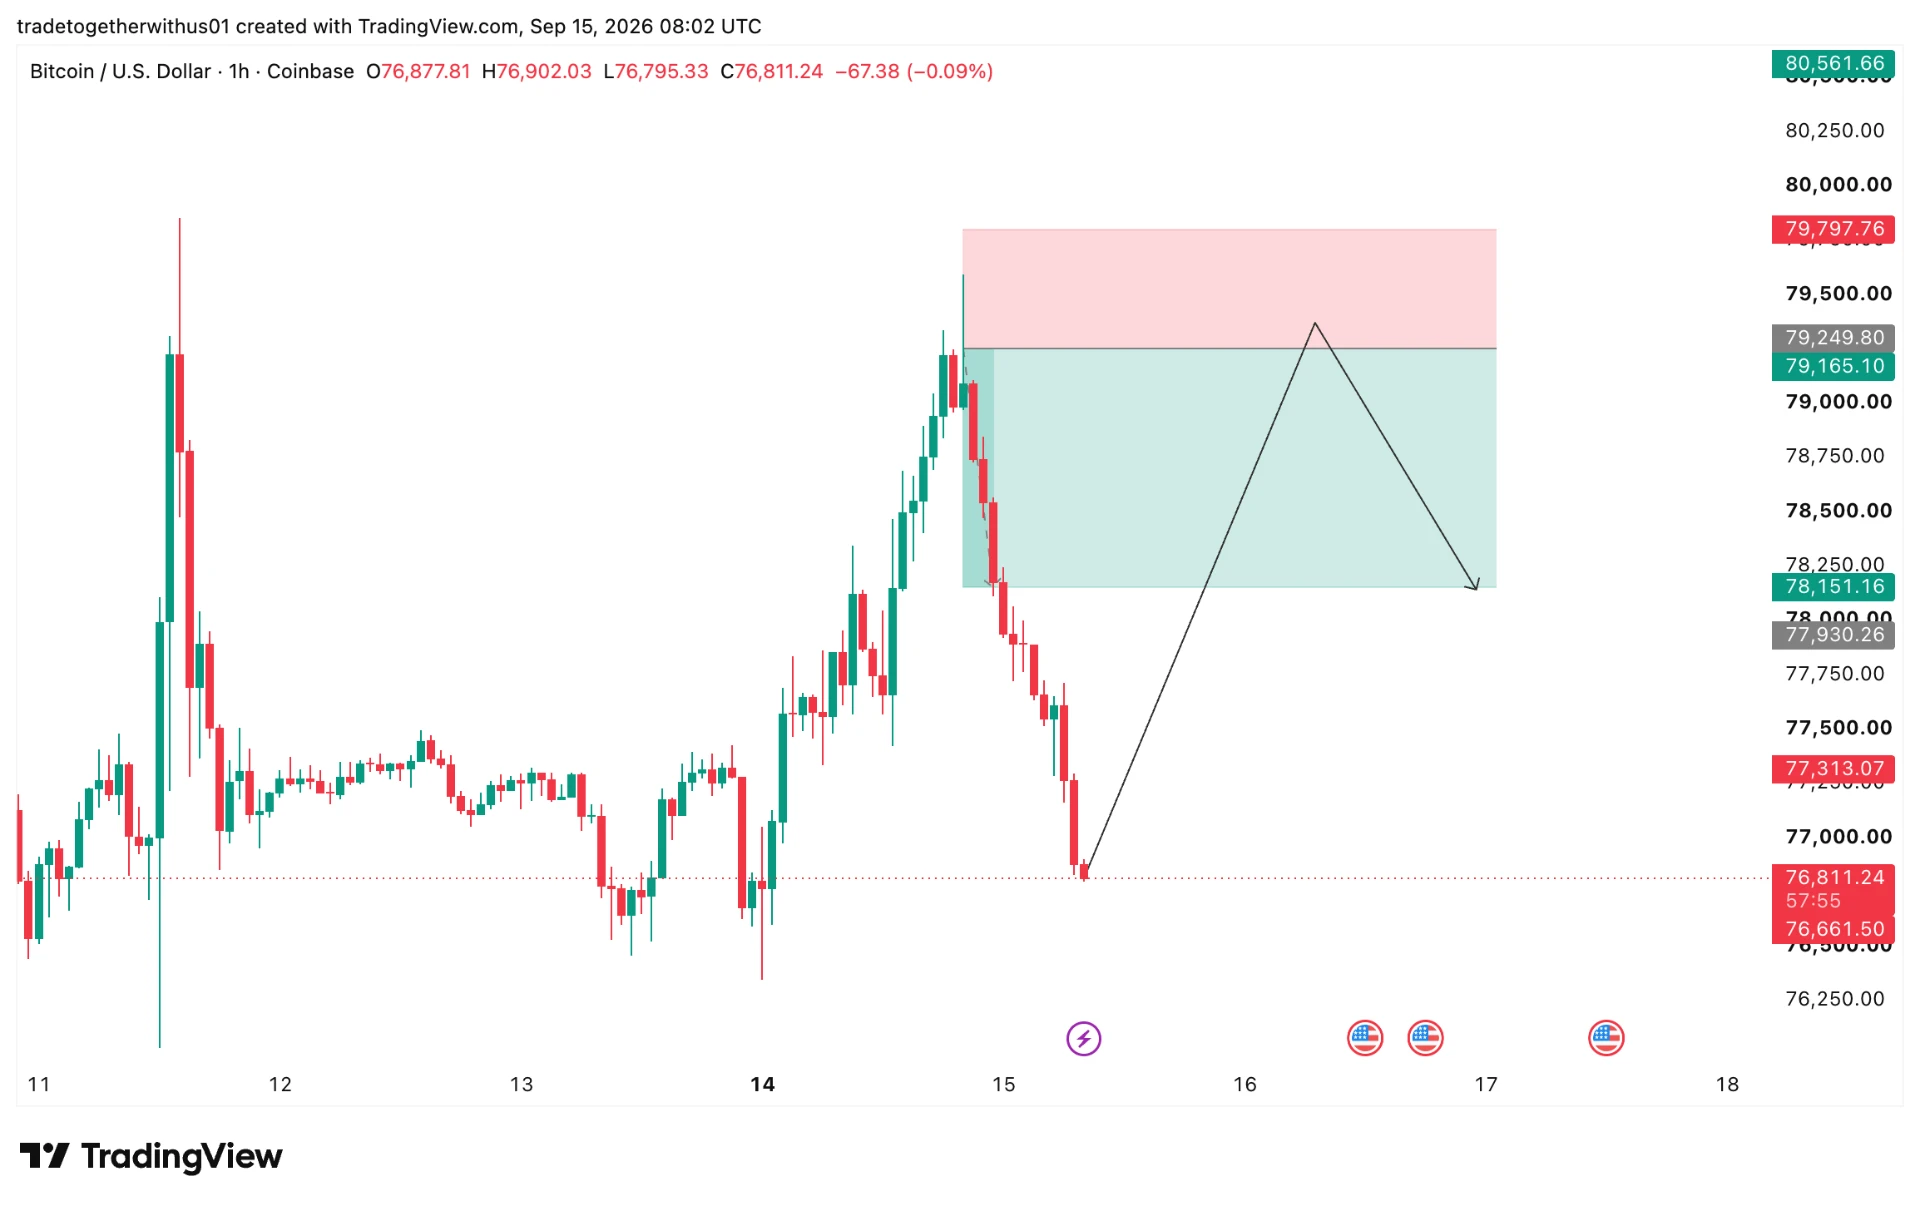
The decline from the higher-timeframe resistance area produced multiple structural breaks, followed by continued selling pressure. The 77,313 and 76,679 areas are important nearby reference levels, while 75,713 represents a deeper support area visible on the chart.
Continued downside structure and acceptance below previous lows would support the continuation of the bearish interpretation.
Bullish Scenario
The bearish interpretation would begin to weaken if Bitcoin successfully reverses the current lower-timeframe structure and starts reclaiming important overhead areas.
A sustained recovery above the 77,930 region, followed by stronger acceptance toward the 79,012–79,165 area, would require the current bearish structure to be reassessed.
A return toward the historical 79,560–79,860 resistance range would be particularly significant because that region has repeatedly generated strong rejection.
Neutral Scenario
If Bitcoin stops producing clear structural breaks and begins consolidating between nearby support and resistance, the market could temporarily enter a range-bound condition.
In that situation, waiting for a fresh structural confirmation would provide a more objective approach than assuming immediate continuation in either direction.
Key Levels and Areas to Watch
The main technical areas identified in this analysis are:
- 79,560–79,860: Historical resistance range with repeated rejection.
- 79,012–79,165: Important intermediate structure and reaction area.
- 77,930: Nearby structural reference during the current decline.
- 77,313–76,679: Important lower levels as bearish momentum develops.
- 75,713: Deeper support and reference area.
The original charted bearish scenario used 79,249.81 as the entry area, 79,797.76 as the invalidation level, and 78,151.16 as the downside objective.
Subsequent price action moved below the 78,151 area and continued toward approximately 77,000, demonstrating that the bearish structure remained active during the observed move. However, this subsequent price behaviour should not be interpreted as evidence that future price movement is guaranteed to continue in the same direction.
Invalidation and Risk Considerations
The key risk to the bearish interpretation is a meaningful recovery that breaks the sequence of lower highs and lower lows on the 5-minute chart. A sustained reclaim of important overhead structure would require the bearish thesis to be reassessed.
Bitcoin can also experience rapid price movements around liquidity events and major market developments. Lower-timeframe analysis is particularly sensitive to sudden volatility, spread and execution conditions.
The broader lesson from this setup is the importance of confluence rather than relying on a single technical signal. Historical resistance, an order-block reaction, a liquidity sweep and lower-timeframe structural confirmation collectively created the basis for the bearish market interpretation.
Conclusion
Bitcoin’s current structure remains bearish after the rejection from the historically significant 79,560–79,860 resistance range. The higher-timeframe rejection, change of character, reaction from the identified order-block volume area, and subsequent liquidity sweep created the initial bearish context. The 5-minute chart then provided additional confirmation through continued bearish market structure and breaks of structure.
For now, the key question is whether Bitcoin can maintain this lower-timeframe bearish structure or reclaim the important levels above. Continued weakness would keep the lower support areas in focus, while a sustained recovery through the nearby structural levels would weaken the bearish interpretation.
The setup highlights the value of combining higher-timeframe resistance with order-block behaviour, liquidity reactions and lower-timeframe market-structure confirmation, rather than relying on a single technical observation. As always, the market remains dynamic, and the analysis should be reassessed if price structure changes.
Explore more analysis from this trading session:
View all london Session Analysis →Explore more forex forecasts and market outlooks:
View Forex Forecast Hub →Forex forecast for this session:
View BTCUSD london Session Forecast →
Written by
Trade Together Research
Trade Together Research is a professional market analysis team providing forex, gold, and crypto trading insights, technical analysis, and educational guides.. Learn more about our research team on the About page.