BTCUSD
Fri Feb 13 2026
More analysis for this pair:
View all BTCUSD market analysis →Forex forecast for this pair:
View BTCUSD forecast →Bitcoin Monthly Overview: Understanding the Bigger Picture
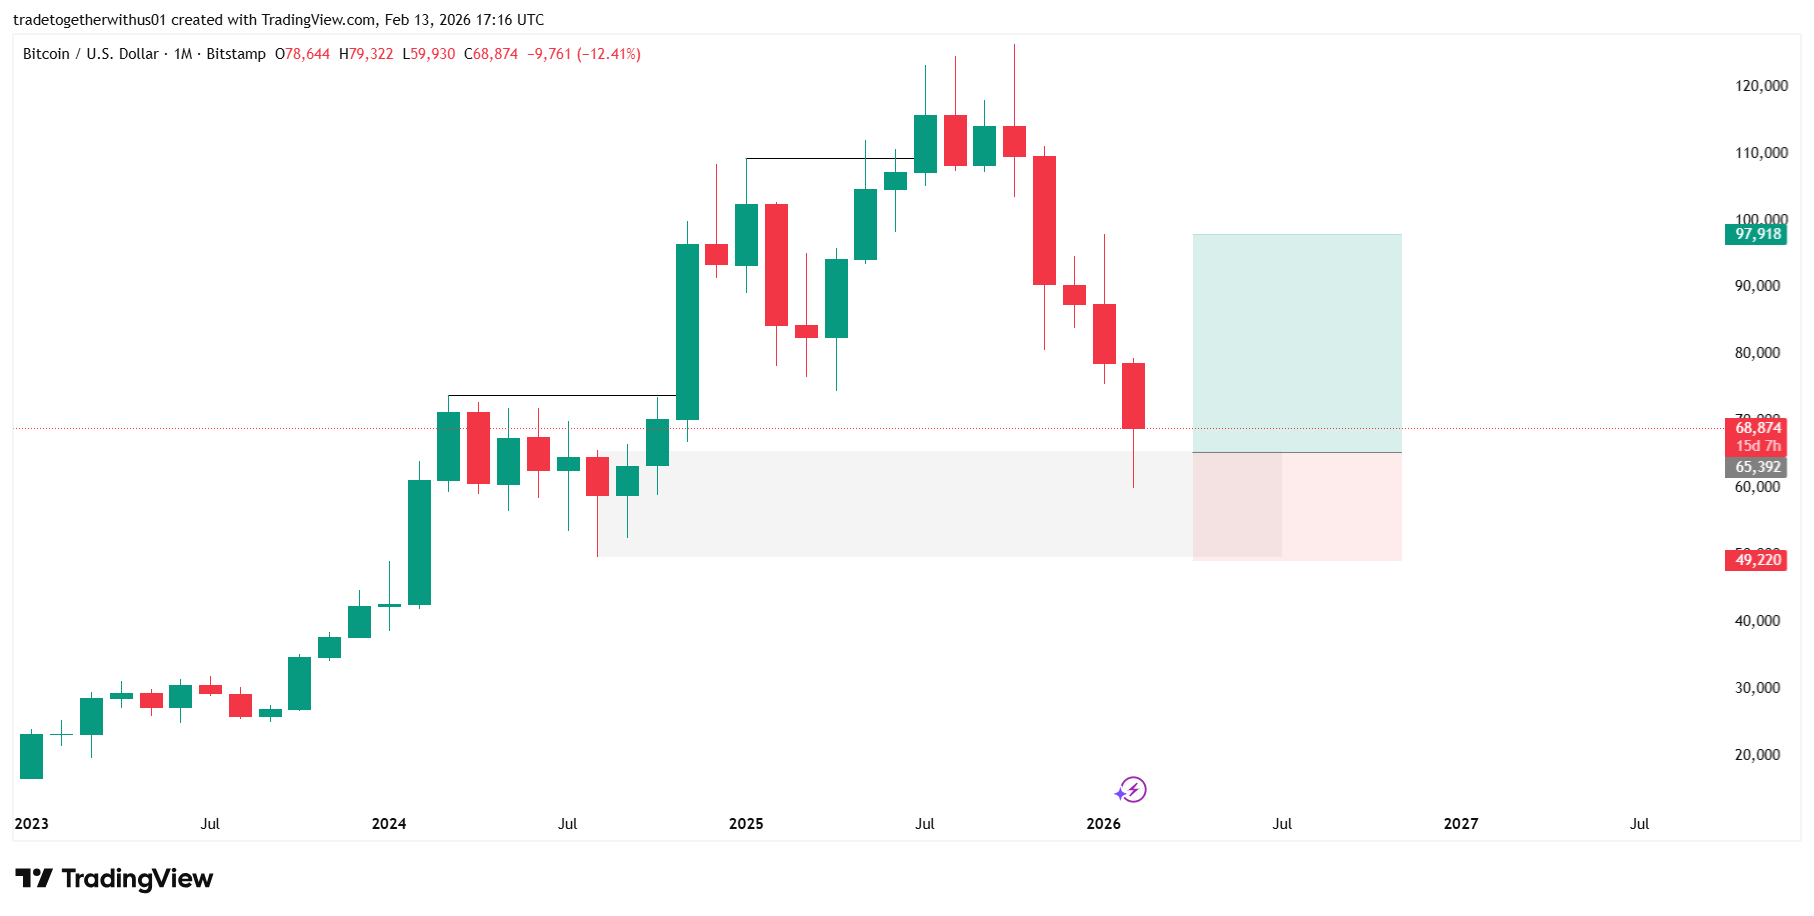
The monthly timeframe is widely used by long-term market participants to evaluate trend direction, structural strength, and risk zones without the noise of short-term volatility. The current BTC/USD monthly chart reflects a market transitioning from a strong expansion phase into a broader corrective or rebalancing cycle.
Higher-timeframe analysis helps investors focus on structural positioning rather than short-term fluctuations, allowing clearer evaluation of risk and long-term opportunity zones.
Market Context: Expansion Followed by Rebalancing
Bitcoin previously experienced a strong directional move characterized by large bullish monthly candles and accelerating momentum. After such expansion phases, markets typically enter periods of consolidation or retracement as liquidity rebalances and participants reassess valuation.
The current pullback appears consistent with historical cycle behavior where momentum pauses before the next major directional decision. Similar phases in prior cycles involved volatility compression before either trend continuation or deeper consolidation.
Higher Timeframe Market Structure
From a structural perspective, the chart currently shows:
- A prior sequence of higher highs and higher lows indicating macro strength.
- Price revisiting a significant monthly support region linked to previous breakout activity.
- Momentum deceleration compared with earlier expansion phases.
As long as price remains structurally supported on the monthly timeframe, the broader framework remains constructive. However, increased volatility around key zones suggests the market is entering a price-discovery and reassessment phase.
Educational Chart Framework
An upper region marks previous resistance where momentum may be tested if buyers regain control and volatility compresses.
1) Structural Participation Zone
This zone represents an area where historical accumulation previously occurred before upward expansion. Re-visits to these levels often test whether long-term demand remains active.
2)Risk Boundary Area
Below the main structural region lies a boundary where sustained monthly acceptance could indicate weakening market structure and potential transition toward prolonged consolidation.
Recovery Zone
This framework illustrates how structural analysis helps define context and risk without implying any directional instruction.
Structure-based analysis provides objective context and risk awareness, helping investors avoid emotionally driven decisions.
Unique Technical Observations from the Monthly Chart
Several characteristics stand out in the current structure:
- Volatility contraction: Recent monthly candles show reduced range compared with the prior expansion phase, often seen during transitional cycles.
- Wick behavior near support: Repeated reactions around the same zone suggest active participation rather than aggressive capitulation.
- Momentum normalization: Indicator behavior and candle structure reflect cooling momentum rather than immediate structural failure.
These observations suggest the market is in a decision phase rather than a confirmed directional shift.
What Global Market Participants Watch Next
Long-term investors and portfolio-focused traders generally monitor:
- Monthly closes relative to major structural zones.
- Stability versus sustained downside acceptance.
- Signs of renewed momentum as price approaches previous resistance areas.
- Changes in volatility that indicate accumulation or distribution phases.
Because monthly candles represent large participation cycles, confirmation typically develops gradually over multiple closes.
Macro Perspective and Cycle Context
Bitcoin historically moves through phases of expansion, correction, accumulation, and renewed momentum. Current price behavior aligns with a mid-cycle cooling phase rather than extreme euphoric or panic conditions. Broader macro factors — including liquidity conditions, institutional participation, and risk sentiment across global markets — can influence how quickly the next phase develops. However, higher-timeframe structure remains the primary guide for long-term analysis.
Risk Disclosure
This content is provided for educational and informational purposes only and does not constitute financial advice. Cryptocurrency markets are volatile and influenced by macroeconomic, regulatory, and sentiment-driven factors.
Technical analysis reflects probabilities rather than certainty. Market conditions can change rapidly, and past structure does not guarantee future outcomes. Readers should conduct independent research and assess their own risk tolerance before making financial decisions.
Frequently Asked Questions
Is monthly Bitcoin analysis suitable for long-term investors?
Yes. Monthly charts help reduce short-term noise and provide clearer visibility into broader market cycles.
Does a monthly correction mean the trend has reversed?
Not necessarily. Corrections are common within ongoing market cycles and often occur before trend continuation or wider consolidation.
Why do professional analysts focus on structure instead of predictions?
The chart outlines a structured risk model that helps explain price behavior from an investor perspective.
Analyst Note
This monthly analysis is part of an ongoing series focused on higher-timeframe market structure and educational market interpretation for global participants.
Explore more analysis from this trading session:
View all newyork Session Analysis →Explore more forex forecasts and market outlooks:
View Forex Forecast Hub →Forex forecast for this session:
View BTCUSD newyork Session Forecast →
Written by
Trade Together Research
Trade Together Research is a professional market analysis team providing forex, gold, and crypto trading insights, technical analysis, and educational guides.. Learn more about our research team on the About page.