EURUSD Technical Analysis — Tuesday, March 31, 2026 | Momentum Shift from Key Demand Zone
Tue Mar 31 2026
More analysis for this pair:
View all EURUSD market analysis →Forex forecast for this pair:
View EURUSD forecast →Market Context
The EUR/USD currency pair recently approached an important structural demand area after an extended downside movement. Markets often react strongly when price returns to zones where significant institutional activity previously occurred.
On the 1-hour timeframe, price interaction with this region produced a visible momentum shift. The reaction suggests that liquidity within this area attracted market participation, leading to a temporary pause in the previous downward pressure.
While the broader structure still requires confirmation, the current reaction offers an educational case study of how markets behave when revisiting high-interest liquidity zones.
Higher Timeframe Structure
From a broader perspective, EUR/USD has been moving within a corrective bearish structure characterized by sequences of lower highs and lower lows across recent sessions.
During this decline, price eventually reached a previously established demand region formed by historical institutional participation. These types of zones often serve as areas where markets rebalance after strong directional moves.
When price revisits such areas, two outcomes typically emerge:
- absorption of selling pressure and short-term stabilization
- continuation of the prevailing trend after liquidity collection
The current price reaction indicates that the market is testing this structural demand region.
Current Chart Structure and Key Observations
On the 1-hour chart, the highlighted zone contains several forms of technical confluence:
- a previously formed order block
- alignment with a fair value gap (FVG)
- a high-volume node identified using fixed range volume analysis
The combination of these factors forms a structural liquidity cluster.
When price revisited this region, momentum shifted noticeably. The initial reaction showed an upward impulse suggesting that selling pressure weakened temporarily within the zone.
On the lower timeframe (5-minute chart), this reaction became clearer through a change of character, where short-term market structure shifted upward following strong momentum.
Such lower timeframe shifts often occur when liquidity is absorbed within a higher timeframe demand region.
Educational Explanation of the Highlighted Price Levels
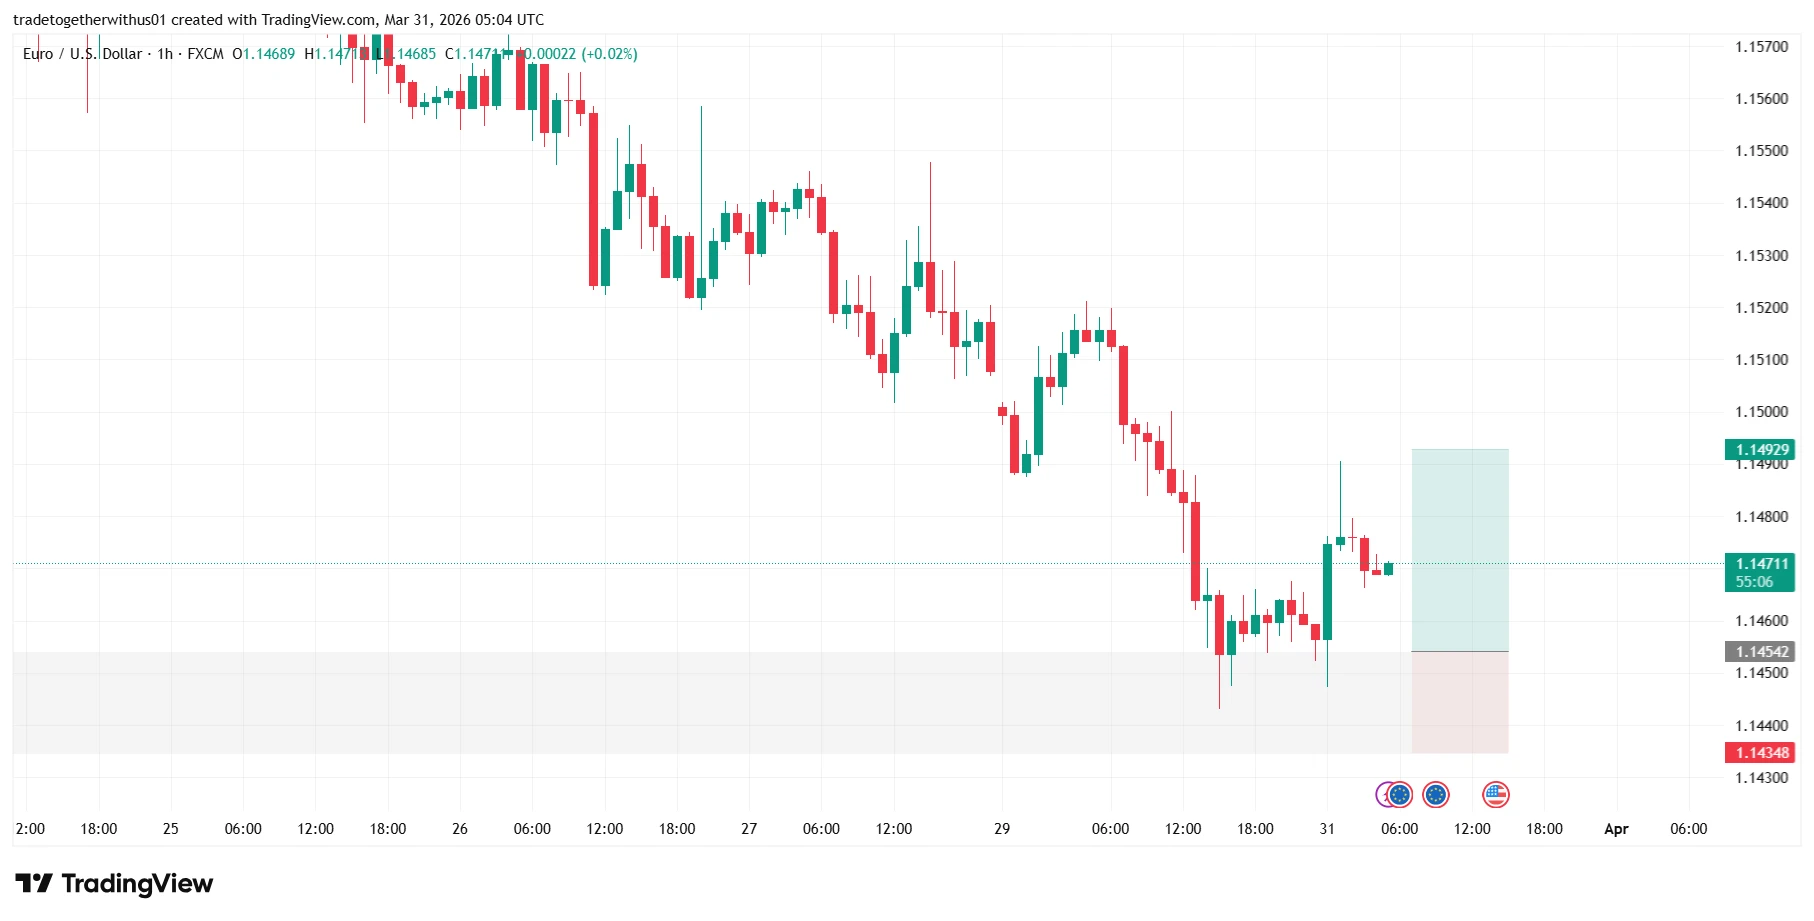
The chart contains three key reference levels that illustrate how structural analysis is performed.
Upper Liquidity Reference
1.14929
This area represents a nearby liquidity region where price previously interacted with supply pressure.
Markets often gravitate toward such zones during short-term corrective movements as liquidity and resting orders accumulate there.
Structural Reaction Area
1.14542
This level sits within the core demand region where price initially reacted after revisiting the previously identified order block and high-volume zone.
Such areas frequently act as temporary equilibrium points where market participants reassess positioning.
Structural Boundary Level
1.14348
The lower boundary marks the level where the current reaction would lose structural support.
A sustained move below this area would indicate that the demand zone failed to maintain balance, potentially allowing the broader bearish momentum to resume.
Alternative Market Scenarios
Momentum Expansion Scenario
If the reaction from the demand region continues to attract participation, price may gradually move toward the upper liquidity region around 1.14929.
This would represent a short-term corrective phase within the broader market structure.
Structural Weakness Scenario
If price begins to lose strength and moves below 1.14348, the current reaction would lose its structural support.
Such behavior would suggest that the dominant bearish pressure remains intact and that the demand zone was unable to absorb selling activity.
Consolidation Scenario
Another possibility is a temporary consolidation phase between the highlighted levels.
Markets frequently enter sideways ranges after strong moves as liquidity accumulates before the next directional expansion develops.
What Market Participants Should Watch Next
Several factors may help determine the next phase of EUR/USD price behavior:
- sustained structure formation above the demand region
- additional momentum shifts on lower timeframes
- price reactions near the upper liquidity region
- structural stability around the lower boundary level
Observing these factors helps traders understand how the market responds to liquidity zones.
Learning Takeaway
This chart provides an educational example of how multiple technical tools can align within a single structural zone. The analysis demonstrates how traders often combine:
- order block identification
- fair value gap analysis
- volume profile observation
- lower timeframe structure shifts
- liquidity mapping
Understanding these interactions helps market participants interpret price behavior around high-interest liquidity areas.
Explore more analysis from this trading session:
View all london Session Analysis →Explore more forex forecasts and market outlooks:
View Forex Forecast Hub →Forex forecast for this session:
View EURUSD london Session Forecast →
Written by
Trade Together Research
Trade Together Research is a professional market analysis team providing forex, gold, and crypto trading insights, technical analysis, and educational guides.. Learn more about our research team on the About page.