GBPUSD 1H Market Structure Analysis – Thursday, April 9, 2026: Supply Zone Reaction Signals Potential Short-Term Weakness
Thu Apr 09 2026
More analysis for this pair:
View all GBPUSD market analysis →Forex forecast for this pair:
View GBPUSD forecast →Market Context
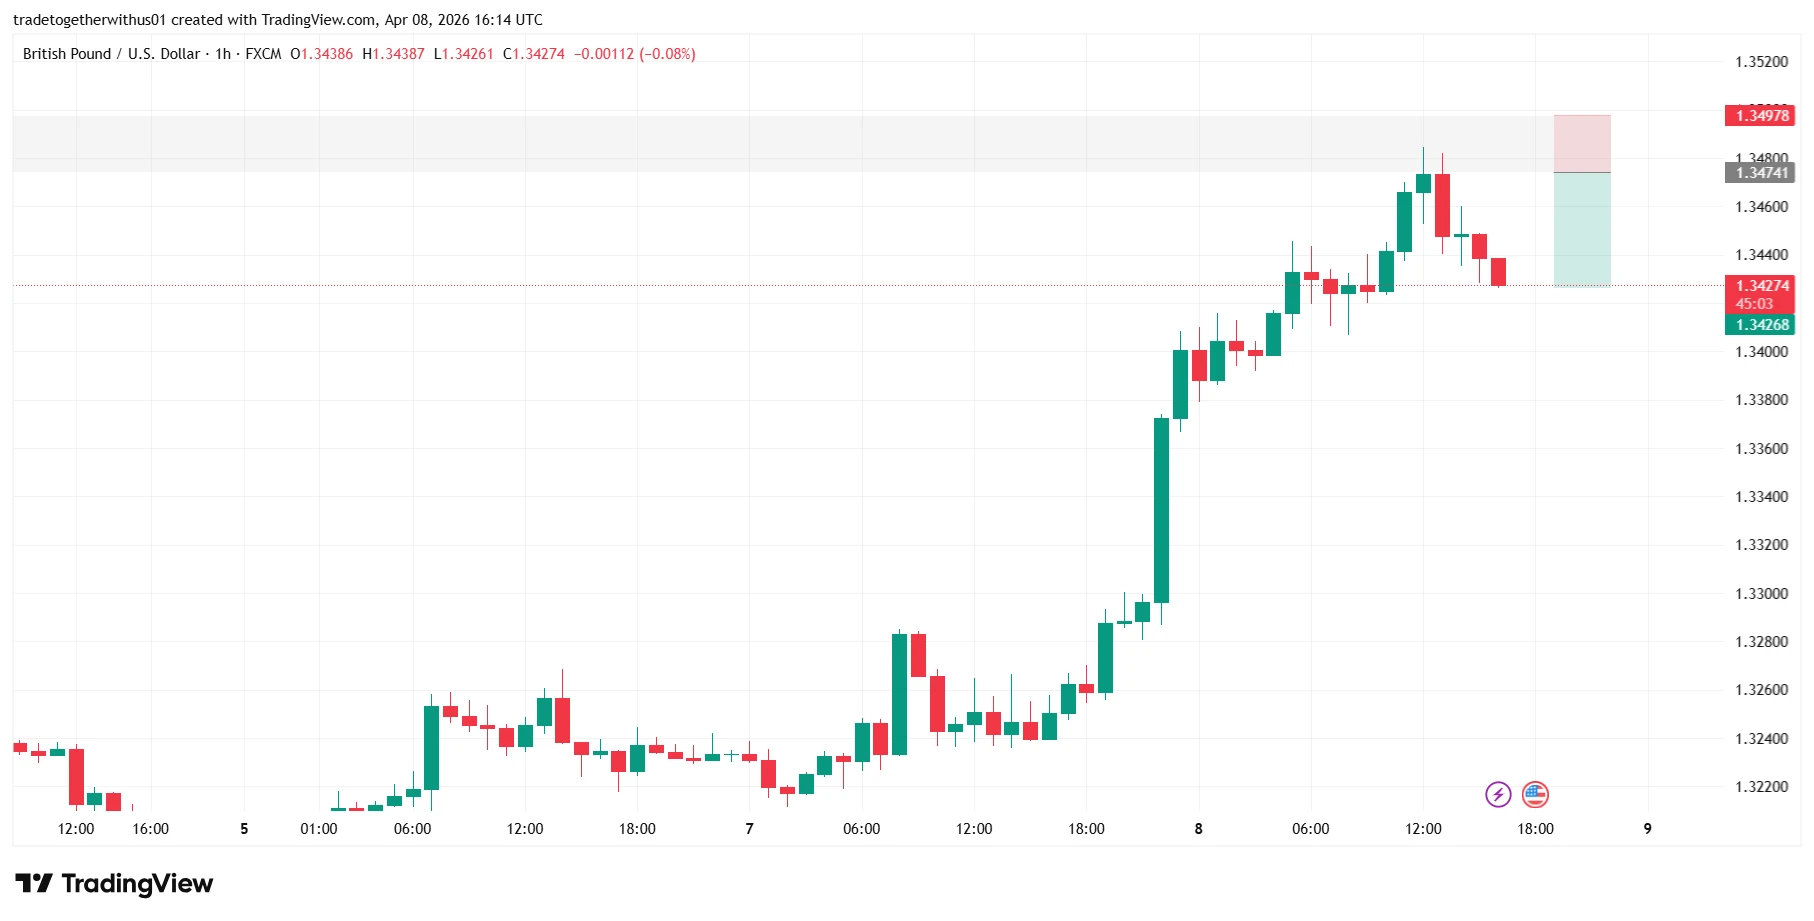
The GBP/USD currency pair recently experienced a strong bullish expansion before encountering resistance near a previously defined structural zone. Following this upward momentum, price action began showing early signs of exhaustion as it approached a key supply region visible on the 1-hour timeframe.
Such reactions are common when markets revisit areas where previous institutional activity occurred. As price interacts with these regions, liquidity shifts can lead to temporary pauses in momentum or short-term structural transitions.
Because this analysis focuses on the 1-hour timeframe, its relevance is primarily short-term and reflects current market conditions as of Thursday, April 9, 2026.
Higher Timeframe Structure Overview
Prior to the recent reaction, GBP/USD displayed a strong impulsive bullish phase, characterized by consecutive higher highs and strong upward momentum.
However, markets often return to areas where large moves previously originated. These regions frequently represent supply zones formed during earlier liquidity imbalances.
When price revisits such zones, market participants reassess positioning, which can temporarily disrupt the existing trend or trigger corrective movements.
Current 1-Hour Chart Structure
On the 1-hour chart, price revisited a previously identified supply region after the strong bullish expansion.
notable wick rejection, suggesting that upward momentum encountered resistance. Shortly afterward, lower-timeframe price behavior displayed a change of character, often interpreted as an early signal of shifting momentum.
Following this development, the market formed a break of structure toward the downside, indicating that short-term directional control may be transitioning.
This sequence — rejection, momentum shift, and structural break — is commonly observed when markets move from an impulsive trend into a corrective phase.
Educational Explanation of the Marked Zones
The highlighted levels on the chart represent structural reference points that help illustrate how price interacts with liquidity.
Upper Risk Boundary – 1.34978
This level marks the upper boundary of the highlighted structural region. If price were to move above this level and sustain momentum, it could weaken the current bearish interpretation and suggest renewed upward pressure.
Structural Supply Area – 1.34741
This region represents the core supply zone where price recently reacted. Such areas often become important technical reference points because they reflect previous concentrations of selling pressure.
Lower Liquidity Area – 1.34268
The lower highlighted level represents a nearby liquidity zone where price previously paused during its upward movement. Markets often revisit these areas as part of natural retracement cycles.
These levels should be interpreted as educational structural zones rather than predictive outcomes.
Alternative Market Scenarios
Potential Continuation
If the market continues respecting the supply zone and bearish structure remains intact, price may gradually explore lower liquidity areas as part of a corrective move.
Structural Invalidation
If price moves above the upper structural boundary and maintains momentum beyond that level, the bearish interpretation would weaken and suggest renewed bullish strength.
Consolidation Phase
Another possible outcome is sideways consolidation, where price oscillates between nearby structural zones as the market redistributes liquidity before the next directional move.
What Market Participants Should Watch Next
Several technical elements could influence how GBP/USD evolves in the coming sessions:
- Whether the supply zone continues to attract selling pressure
- The strength of bearish momentum after the structural break
- Liquidity reactions near nearby support areas
- Signs of consolidation following the recent bullish expansion
Monitoring these factors can help market participants better interpret evolving price behavior.
Learning Takeaway
One of the most valuable lessons from this chart is how market transitions often begin with subtle signals. Rejection wicks, changes in character on lower timeframes, and structural breaks can collectively reveal shifts in momentum.
Understanding how price interacts with supply zones, liquidity levels, and structural changes can help traders analyze market behavior more objectively.
Regardless of the eventual outcome, recognizing these structural dynamics is an essential component of price-action analysis.
Explore more analysis from this trading session:
View all london Session Analysis →Explore more forex forecasts and market outlooks:
View Forex Forecast Hub →Forex forecast for this session:
View GBPUSD london Session Forecast →
Written by
Trade Together Research
Trade Together Research is a professional market analysis team providing forex, gold, and crypto trading insights, technical analysis, and educational guides.. Learn more about our research team on the About page.