GBPUSD 1H Technical Analysis – Thursday, February 26, 2026 | Bearish Intraday Shift Near 1.35826 Within Broader Recovery
Thu Feb 26 2026
More analysis for this pair:
View all GBPUSD market analysis →Forex forecast for this pair:
View GBPUSD forecast →Market Overview
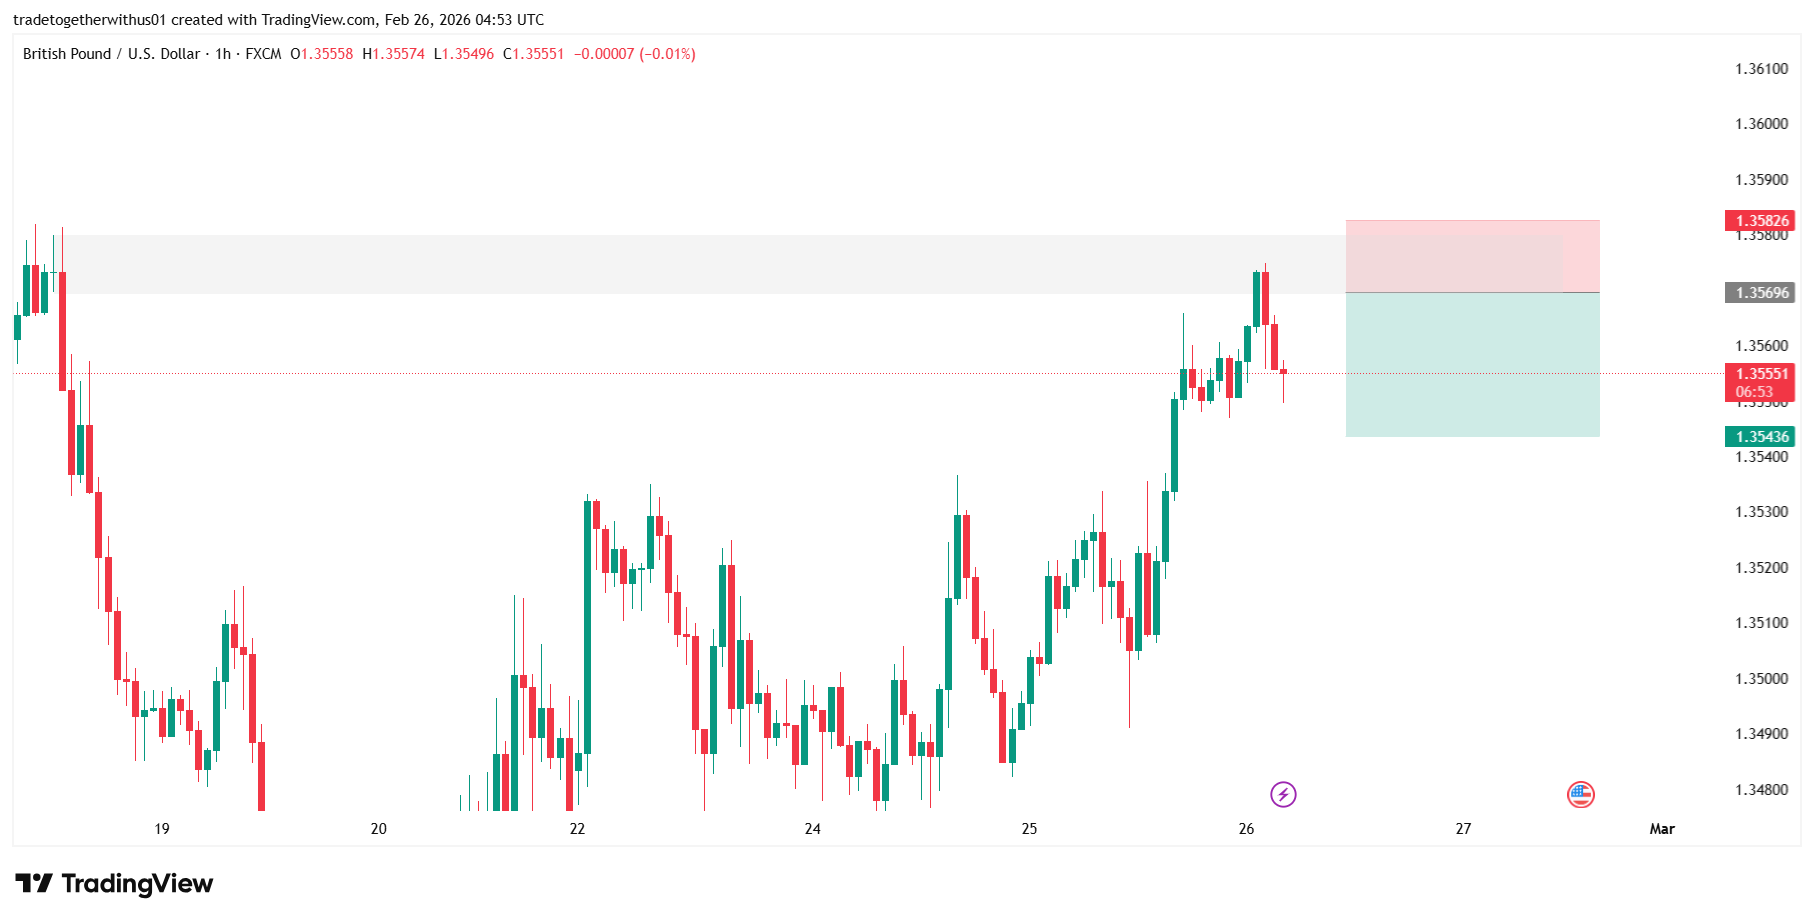
GBP/USD is trading near 1.35556 after reacting from the 1.35826 region — an area that has repeatedly acted as a structural pivot in recent sessions. The pair has rebounded from the 1.34400–1.34500 base, but recent intraday price behavior suggests localized exhaustion near resistance.
This analysis evaluates the 5-minute, 1-hour, and 4-hour timeframes to assess structure, momentum shifts, and potential forward scenarios using purely technical principles.
Higher Timeframe Structure (4H Context)
On the 4-hour chart, GBP/USD previously declined from the 1.38000 region and established a corrective bearish phase. However, the recent recovery from the 1.34400 swing low has shifted short-term structure into a rebound phase.
Key 4H observations:
- Reaction from a higher-timeframe demand zone near 1.34400
- Formation of short-term higher lows
- Gradual retracement toward prior supply near 1.35800–1.36000
The broader 4-hour context remains transitional. While the macro swing shows prior downside pressure, the current leg reflects corrective recovery rather than confirmed trend continuation.
1-Hour Chart: Structural Framework
On the 1-hour timeframe:
- The 1.35826 region has functioned repeatedly as both support and resistance.
- Price recently revisited this level and showed visible rejection.
- The area aligns with a previously formed order block.
- Volume profile analysis indicates elevated historical participation around this zone, suggesting institutional positioning interest.
From a structural standpoint, the 1-hour trend has been forming higher lows since the 1.34400 base. This indicates that short-term bullish structure is still technically intact.
Therefore, any downside continuation from the 1.35826 region develops against the immediate 1-hour recovery structure — increasing structural risk.
5-Minute Chart: Change of Character Confirmation
The 5-minute timeframe shows a clear downside Change of Character (ChoCh) after price tapped the 1.35826 structural area.
Key intraday developments:
- Loss of upward momentum.
- Impulsive bearish displacement.
- Formation of lower highs and lower lows.
- Momentum shift supporting short-term downside rotation.
This lower-timeframe structural shift provides tactical alignment for intraday weakness, but remains counter to the broader 1-hour higher-low sequence.
Educational Breakdown of the Marked Structural Zones
Structural Reaction Zone (Around 1.35826)
This zone represents confluence of:
- Historical support/resistance behavior.
- A prior order block formation.
- A high-volume participation node.
- A psychological round-number proximity near 1.36000.
When liquidity, structure, and volume converge, price frequently reacts with measurable volatility.
Risk Boundary (Upper Invalidation Area)
The upper marked area above 1.35826 represents structural invalidation of the short-term bearish thesis. Sustained acceptance above this region would indicate that the 1-hour bullish recovery remains dominant.
Downside Objective Zone
The lower marked area aligns with:
- 1.35436 intraday liquidity.
- Prior minor consolidation support.
- Inefficiency created during the recent upward impulse.
This region represents a potential rebalancing area if downside continuation develops.
Alternative Market Scenarios
1. Bearish Continuation Scenario
If 5-minute bearish structure extends and the 1-hour chart begins printing a lower high beneath 1.35826:
- Rotation toward 1.35436 becomes structurally reasonable.
- Further extension toward 1.35000–1.35200 may follow if momentum accelerates.
- Liquidity below recent intraday lows may be targeted.
This scenario requires continued rejection from the 1.35826 region.
2. Higher Timeframe Continuation Scenario
If the 1-hour higher-low structure holds:
- Price may reclaim 1.35826 decisively.
- Continuation toward 1.36200–1.36500 becomes structurally feasible.
- The 5-minute ChoCh would represent only a temporary pullback.
Consolidation Scenario
Given multi-timeframe conflict:
- GBP/USD may compress between 1.35436 and 1.35826.
- Liquidity sweeps may occur on both sides before expansion.
- Range development may precede directional clarity.
What Market Participants Should Monitor
- Structural acceptance or rejection near 1.35826.
- Whether the 1-hour chart produces a confirmed lower high.
- Momentum continuation following the 5-minute ChoCh.
- Volume behavior around high-participation nodes.
Multi-timeframe alignment remains the key factor in evaluating probability.
Structural Risk Note
Although intraday momentum has shifted bearish, the 1-hour timeframe still reflects a short-term upward structure from the 1.34400 base. Counter-structure positioning increases volatility exposure and the probability of failed breakdowns.
Learning Takeaway
This setup highlights several important educational concepts:
- Structural confluence strengthens reaction zones.
- Lower-timeframe momentum shifts must align with higher-timeframe structure for sustainability.
- Volume-based reference areas often act as institutional decision points.
- Multi-timeframe conflict frequently leads to consolidation before expansion.
Understanding structure interaction is more valuable than directional bias.
Explore more analysis from this trading session:
View all asia Session Analysis →Explore more forex forecasts and market outlooks:
View Forex Forecast Hub →Forex forecast for this session:
View GBPUSD asia Session Forecast →
Written by
Trade Together Research
Trade Together Research is a professional market analysis team providing forex, gold, and crypto trading insights, technical analysis, and educational guides.. Learn more about our research team on the About page.