GBPUSD
Mon Feb 16 2026
More analysis for this pair:
View all GBPUSD market analysis →Forex forecast for this pair:
View GBPUSD forecast →GBP/USD 1H Technical Structure Analysis: Intraday Range Dynamics Beneath Key Resistance
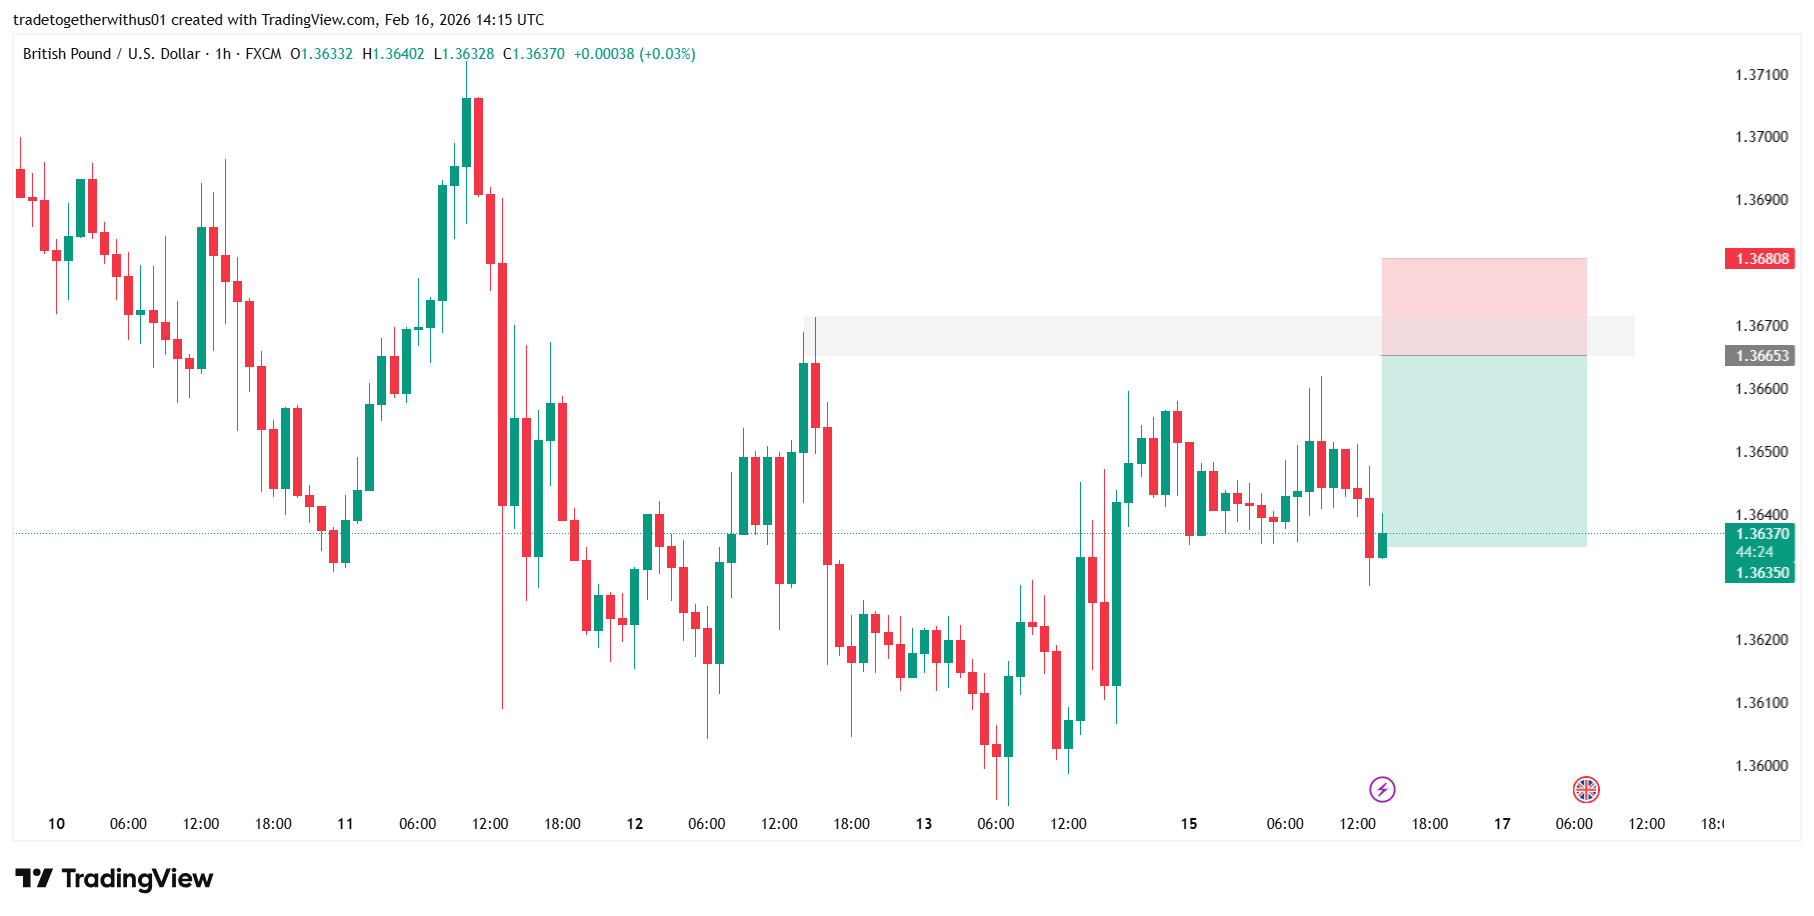
GBP/USD continues to rotate within a defined intraday range as directional momentum fades following prior volatility expansion. Price action reflects a temporary equilibrium between opposing flows, with market participants reassessing valuation near short-term resistance levels.
The session unfolds under reduced liquidity conditions due to a US banking holiday, a factor that typically lowers participation from major institutions and can amplify short-term price inefficiencies or extended consolidation behavior.
Higher Timeframe Structural Context
From a broader structural perspective, the pair appears to be transitioning from an impulsive phase into a rebalancing environment.
Key higher-timeframe characteristics include:
- - A prior bullish leg that lost momentum as price approached overhead liquidity.
- - Failure to establish sustained higher highs, suggesting weakening upside initiative.
- - Development of rotational price action, often associated with distribution or accumulation phases.
When higher timeframe momentum pauses, intraday charts frequently exhibit overlapping candles and repeated tests of similar price zones — conditions currently visible on the 1H chart.
Current 1H Structure and Core Observations
1. Development of a Local Range
Price has shifted into a horizontal structure bounded by:
- - An upper resistance band where advances repeatedly stall.
- - A lower support region attracting responsive demand.
This range behavior indicates neutral short-term order flow rather than directional conviction.
2. Resistance Absorption Dynamics
The marked upper zone represents a region where supply consistently re-emerges. Multiple tests without clean acceptance above suggest absorption of bullish momentum and potential liquidity harvesting near local highs.
3. Compression and Momentum Deceleration
Candle structure shows reduced expansion and increasing overlap, indicating declining momentum. Volatility compression typically precedes either:
- - A breakout with renewed participation, or
- - Further rotational movement as liquidity seeks balance.
4. Short-Term Structural Neutrality
Until price exits the established boundaries decisively, the prevailing condition remains structurally neutral despite intraday fluctuations.
Educational Interpretation of the Marked Zones
The marked areas should be understood as structural reference zones used to interpret market behavior rather than actionable levels.
1. Upper Zone (Structural Supply / Resistance)
This region marks prior rejection points and likely contains resting liquidity. Price interaction here helps reveal whether sellers maintain control or if acceptance above indicates a structural shift.
2. Intermediate Risk Zone (Structure Invalidation Area)
The red-marked area represents a threshold where the current range thesis would weaken if price establishes sustained activity beyond it. In educational terms, such zones define where market structure transitions from one narrative to another.
3. Lower Objective Zone (Liquidity / Rebalancing Area)
The green zone aligns with a lower range boundary and prior swing reactions. Markets often revisit these areas during rotational phases as liquidity redistributes across the range.
Alternative Market Scenarios
Scenario 1 — Upside Structural Continuation
If price achieves clear acceptance above the resistance zone with expanding momentum, the market could transition from rotation into continuation, indicating renewed initiative flow.
Scenario 2 — Rejection and Rotation Lower
Failure to maintain position near the upper boundary may lead to rotation toward lower liquidity zones within the existing range, reinforcing mean-reversion behavior.
Scenario 3 — Prolonged Consolidation
Given reduced participation during holiday conditions, the market may continue oscillating within established boundaries until normal liquidity returns and directional conviction emerges.
What Market Participants Should Watch Next
Key signals for evaluating structure evolution include:
- - Closing behavior around the upper resistance boundary.
- - Expansion or contraction of candle ranges as liquidity returns.
- - Formation of higher lows versus lower highs within the range.
- - Momentum confirmation following scheduled macro or session transitions.
In reduced-liquidity environments, structural confirmation often matters more than initial directional movement.
Learning Takeaway
This setup highlights several institutional-level concepts:
- - Market phases alternate between expansion and balance.
- - Resistance zones represent areas of order flow interaction, not fixed reversal points.
- - Liquidity conditions heavily influence intraday structure.
- - Range environments offer valuable insights into positioning and sentiment shifts.
Understanding these dynamics helps market observers interpret price behavior independently of directional bias.
Market participants are encouraged to combine this structural analysis with their own research, confirmation methods, and risk frameworks before forming any directional bias.
Explore more analysis from this trading session:
View all newyork Session Analysis →Explore more forex forecasts and market outlooks:
View Forex Forecast Hub →Forex forecast for this session:
View GBPUSD newyork Session Forecast →
Written by
Trade Together Research
Trade Together Research is a professional market analysis team providing forex, gold, and crypto trading insights, technical analysis, and educational guides.. Learn more about our research team on the About page.