XAUUSD (Gold) Forecast Today (Thursday, March 12, 2026): Bullish Structure Holds as Price Tests Demand Zone
Thu Mar 12 2026
More analysis for this pair:
View all XAUUSD market analysis →Forex forecast for this pair:
View XAUUSD forecast →Market Context
Gold (XAUUSD) continues to attract attention across global financial markets as investors monitor price behavior around key technical zones. Recent price action shows a developing structural shift that may influence short-term momentum while the broader trend remains constructive.
The current chart structure highlights a retracement into a previously established demand region after an earlier upside move. Such pullbacks often provide insight into whether underlying bullish momentum remains intact or if the market is transitioning into consolidation.
Higher Timeframe Structure Analysis
From a higher timeframe perspective, gold continues to maintain an overall upward structural bias. The broader structure indicates:
- A sequence of higher highs and higher lows
- Strong impulsive moves followed by controlled pullbacks
- Demand zones consistently supporting price
This type of structure typically suggests that buyers have maintained control over the broader market narrative. When price retraces within an uptrend, market participants often observe whether demand zones continue to defend the structure.
The current retracement appears to be occurring within the context of this broader bullish framework rather than signaling an immediate trend reversal.
Current 1-Hour Chart Structure and Key Observations
On the 1-hour timeframe, price action recently showed signs of a change in character (CHoCH) toward the upside.
This structural shift can be observed after a period of corrective movement, where the market began to reclaim higher levels and establish bullish momentum again.
Key observations from the chart include:
- Price initially moved lower before forming a local structural base
- A momentum impulse upward created a shift in short-term structure
- The market is now undergoing a retracement phase
- The retracement is approaching a previous demand candle region
Such retracements are common after impulsive movements, as markets frequently revisit areas where institutional participation previously occurred.
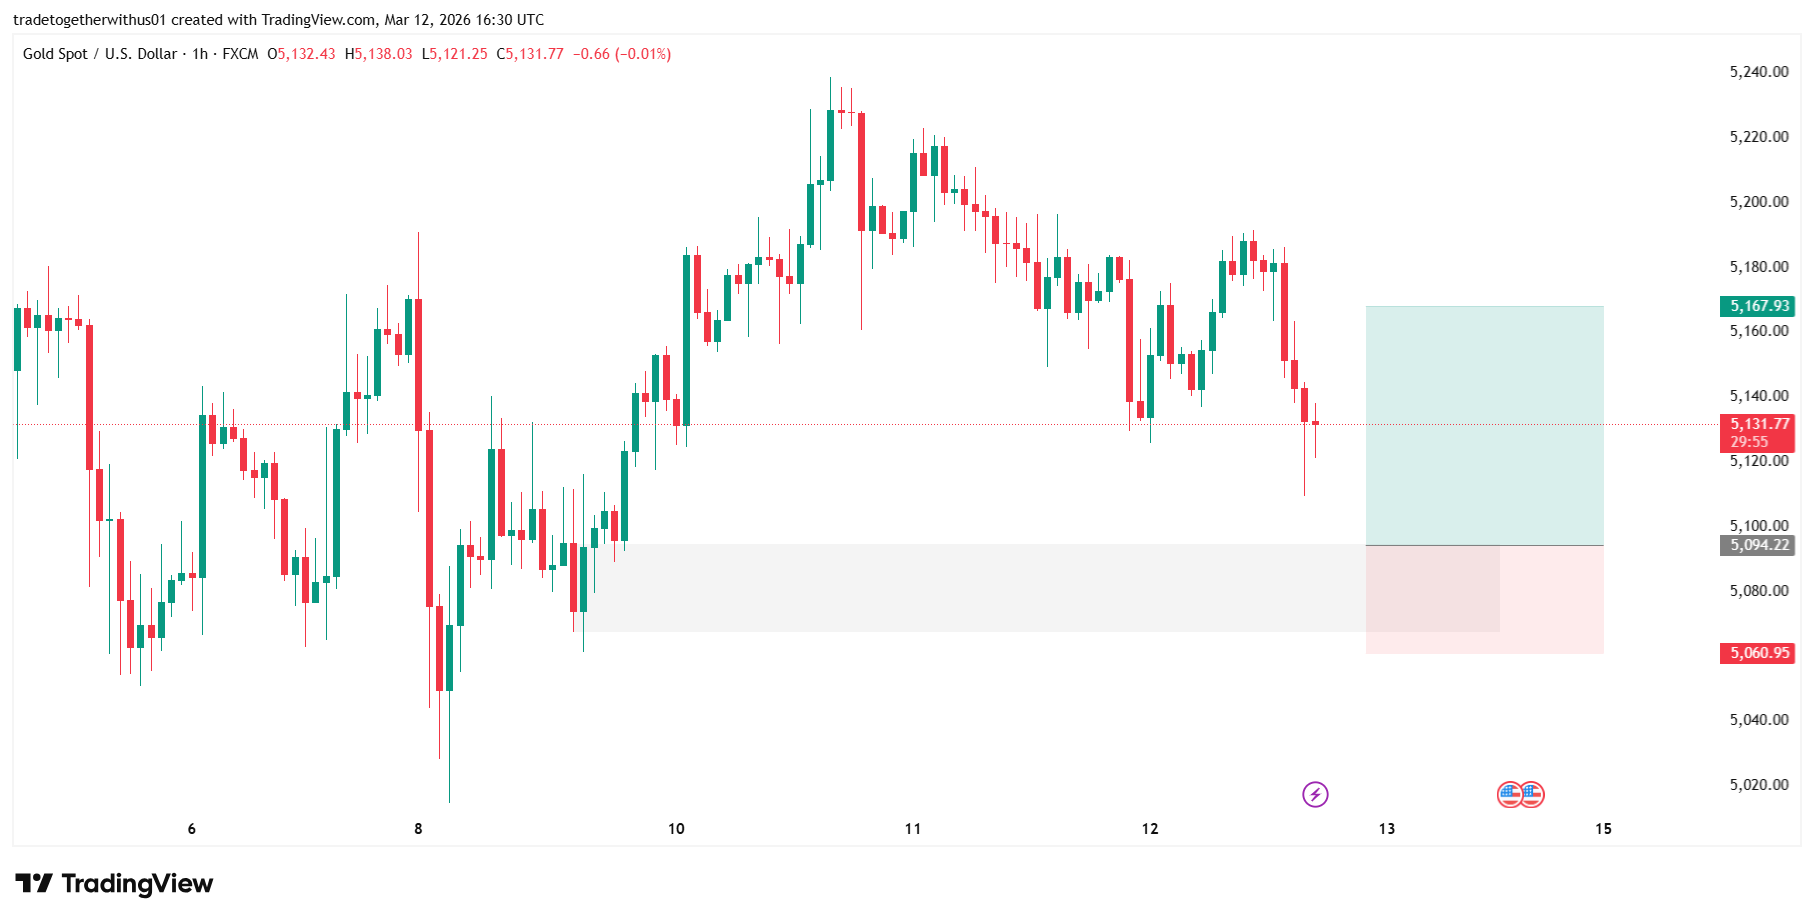
Educational Explanation of the Marked Zones
The chart highlights three primary structural regions.
Entry Area (Structural Reaction Zone)
The gray zone marks an area where price previously showed strong upward momentum. This region can be interpreted as a demand zone, where market participants historically absorbed selling pressure.
When price returns to such zones, analysts typically monitor whether:
- Buyers step in again
- Price stabilizes
- Momentum begins to shift upward
The zone therefore represents an area of interest, rather than a deterministic outcome.
Risk Zone (Lower Structural Boundary)
The lower red zone marks the structural invalidation region.
If price moves significantly below this area, it could suggest:
- The demand zone has weakened
- Market participants are no longer defending that level
- Short-term bullish structure may be compromised
Such zones help analysts understand where the structural narrative might change.
Target Area (Upper Liquidity Zone)
The green area above represents a potential liquidity region, where price may encounter previous supply or profit-taking pressure.
Markets often gravitate toward such zones due to:
- Previous highs
- Unfilled orders
- Liquidity clusters
If bullish momentum resumes from the demand region, this area could become a natural point where price reaction may occur.
Alternative Market Scenarios
Markets rarely move in a straight line. Several possible scenarios could unfold from the current structure.
1. Bullish Continuation Scenario
If the demand zone holds and buyers regain momentum:
- Price could establish a higher low
- Short-term bullish structure may remain intact
- Market momentum could rotate toward the upper liquidity region
This scenario would align with the broader higher timeframe uptrend.
2. Structural Invalidation Scenario
If price moves decisively below the lower structural boundary:
- The current demand zone may fail
- Short-term market structure may shift bearish
- Deeper retracement toward lower support zones could develop
This would suggest weakening bullish momentum on the lower timeframe.
3. Consolidation Scenario
Markets frequently enter sideways phases after strong impulsive moves. In this case:
- Price may remain inside the zone
- Volatility could decrease
- Market participants may wait for new catalysts
Such consolidation often precedes the next directional expansion.
What Market Participants Should Watch Next
Several factors may help determine the next phase of price action:
-
Reaction inside the demand zone
-
Strength of bullish or bearish candles within the zone
-
Volume behavior during the retracement
-
Whether the market maintains higher lows
A strong reaction from this region could reinforce the broader bullish structure, while weakness could suggest a shift in short-term momentum.
Learning Takeaway
This chart provides an excellent example of how traders study market structure and liquidity zones rather than relying on predictions.
Key lessons include:
- Trends often include retracements before continuation
- Structural zones help define areas of interest
- Multiple scenarios should always be considered
- Context from higher timeframes is essential
Understanding these principles helps market participants develop a more objective and structured approach to analyzing financial markets.
Explore more analysis from this trading session:
View all newyork Session Analysis →Explore more forex forecasts and market outlooks:
View Forex Forecast Hub →Forex forecast for this session:
View XAUUSD newyork Session Forecast →
Written by
Trade Together Research
Trade Together Research is a professional market analysis team providing forex, gold, and crypto trading insights, technical analysis, and educational guides.. Learn more about our research team on the About page.