NASDAQ Price Action Analysis – Monday, August 31, 2026 | 1H & 5M Technical Outlook
Mon Aug 31 2026
More analysis for this pair:
View all NASDAQ market analysis →Forex forecast for this pair:
View NASDAQ forecast →Market Context
NAS100 is showing a notable short-term technical development after breaking above a long-standing resistance area visible on the 1-hour timeframe.
The yellow-marked zone on the 1-hour chart represents an area that had previously acted as resistance. Price eventually moved above this region with strong upward momentum before retracing back toward the breakout area.
The subsequent reaction around this zone is important because a previously established resistance area can become a significant reference point after a breakout. The current structure therefore focuses on how price behaves around this retest rather than assuming that the breakout will automatically continue.
1-Hour NAS100 Market Structure
The 1-hour chart provides the broader context for the setup.
The main technical developments are:
- A clearly defined resistance zone developed over an extended period.
- Price broke above the resistance with strong bullish momentum.
- The market subsequently retraced toward the broken resistance area.
- Price showed a renewed reaction higher from the retest region.
This creates a short-term upside-oriented structure while the market remains above the important breakout area.
The analysis does not treat the move as a confirmed long-term trend reversal. Instead, the focus is on the potential continuation of the current short-term structure.
5-Minute NAS100 Price Action
The 5-minute timeframe provides a closer view of the price reaction.
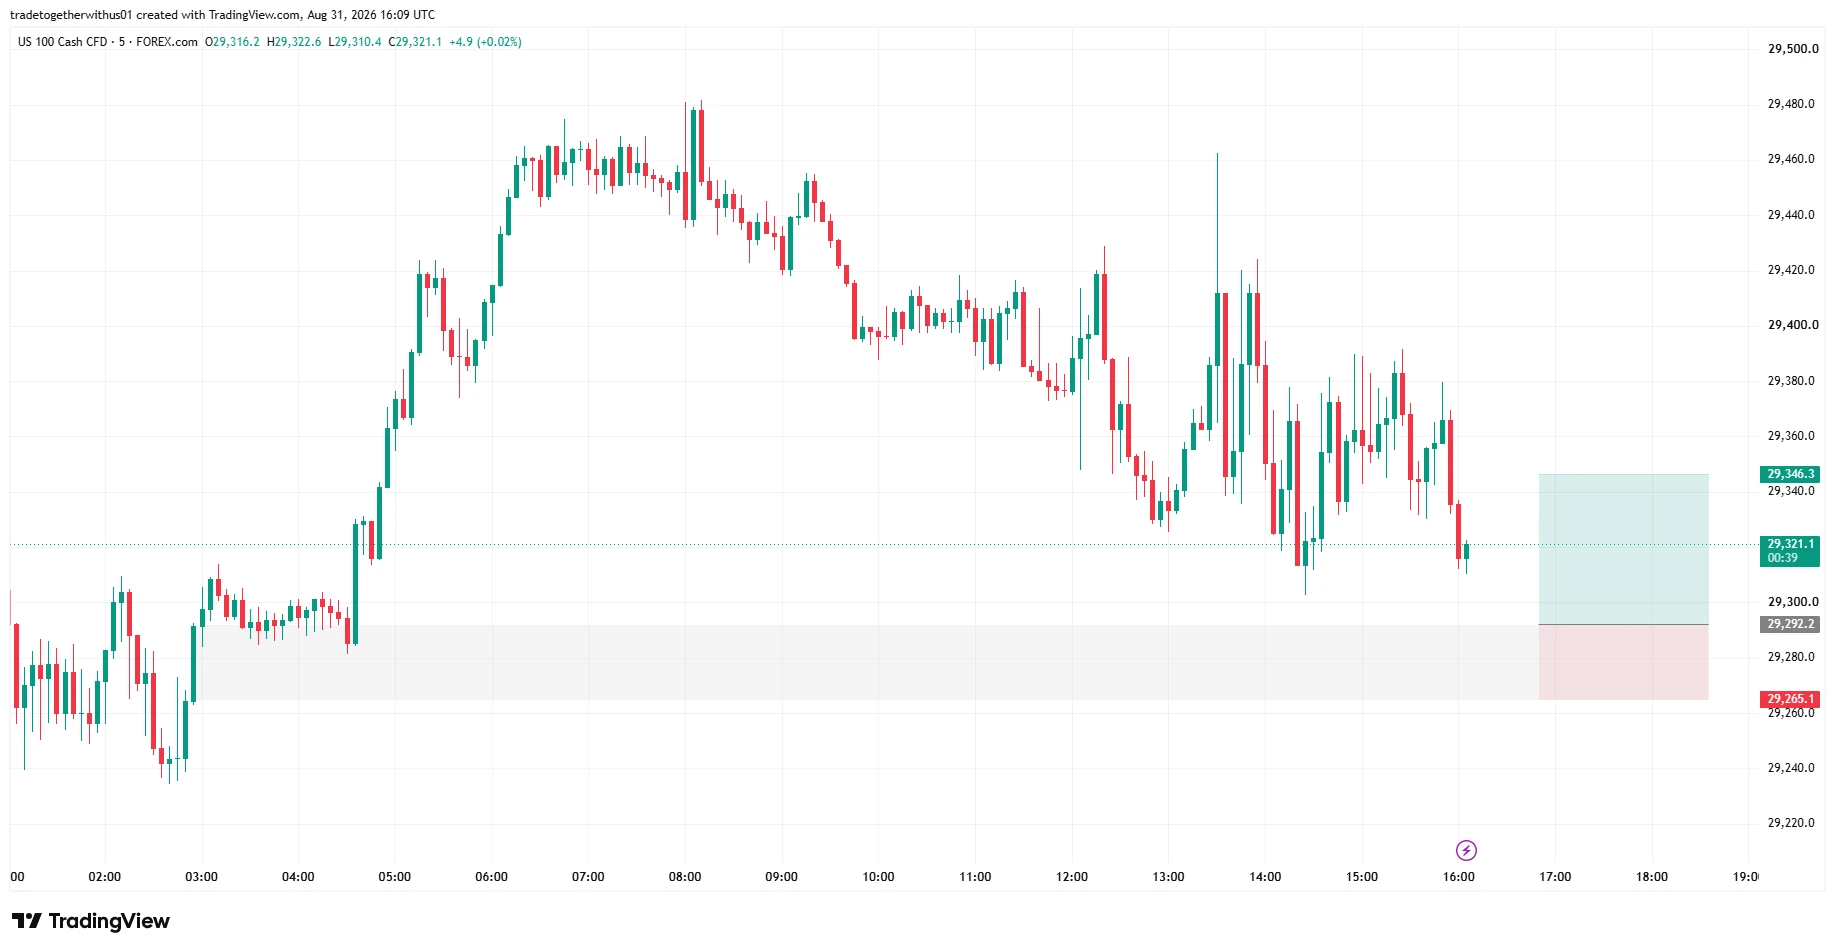
After the retracement from the higher levels, the chart shows a strong upward movement accompanied by a notable order block and fair value gap.
The order block provides a defined technical reference area, while the fair value gap highlights an imbalance created during the strong momentum movement.
The combination of the 1-hour breakout-and-retest structure with the 5-minute order block creates the technical framework being studied in this analysis.
Key Technical Levels
The main levels identified from the chart are:
Entry Reference Area: 29,293.8
Lower Risk Boundary: 29,265.1
Upside Reference Area: 29,350.8
The 29,293.8 area is positioned around the identified 5-minute order block and the broader breakout-retest region.
The 29,265.1 level represents the defined downside risk boundary within the illustrated setup.
The 29,350.8 area represents the corresponding upside reference level used for the approximately 1:2 risk-to-reward framework.
These levels should be considered technical reference points rather than guaranteed price destinations.
Setup Logic
The technical framework begins with the 1-hour resistance breakout.
Price moved above the established resistance zone with strong momentum and later retraced toward the same area. This retest provides an opportunity to examine whether the market can maintain the higher price structure.
On the 5-minute chart, the retracement develops around a notable order block and fair value gap. The subsequent reaction from this area provides the lower-timeframe context for the setup.
The illustrated framework uses:
- Technical Reference Level: 29,293.8
- Invalidation Level: 29,265.1
- Upside Reference Level: 29,350.8
- Scenario Risk Framework: Approximately 1:2
- Volatility Reference: 0.75 ATR
- Timeframes: 1H and 5M
The purpose of using these predefined levels is to establish a clear relationship between the potential upside reference and the point at which the technical structure would be considered invalid.
What Market Participants Should Watch Next
The key factor to monitor is price behavior around the 29,293.8–29,265.1 region.
If price continues to hold above the broader breakout area and maintains the short-term structure on the 5-minute timeframe, the upside structure remains technically relevant.
On the other hand, a decisive move below the defined structural risk area would weaken the current short-term upside scenario and could indicate that the breakout-retest structure requires further reassessment.
US economic data, changes in market volatility, and broader US equity-market sentiment can also influence NAS100 price action, particularly during periods of increased market activity.
Educational Perspective
This NAS100 analysis demonstrates how multiple timeframes can be combined to study price structure.
The 1-hour timeframe establishes the broader resistance breakout and subsequent retest, while the 5-minute timeframe provides more detailed information about the reaction around the technical zone.
Order blocks, fair value gaps, breakouts, and retests are technical concepts that can help traders organize market observations. They should not be interpreted as guarantees of future price movement.
A disciplined approach involves defining the technical scenario, identifying invalidation conditions, and understanding the potential risk before considering any market exposure.
Disclaimer
This content is provided for educational and informational purposes only. It does not constitute investment advice, a trading recommendation, solicitation, or an offer to buy or sell any financial instrument. Trading leveraged products and CFDs involves substantial risk of loss. Past price behavior does not guarantee future results. Readers should conduct their own research and consider their individual financial circumstances and risk tolerance before making any financial decision.
Explore more analysis from this trading session:
View all newyork Session Analysis →Explore more forex forecasts and market outlooks:
View Forex Forecast Hub →Forex forecast for this session:
View NASDAQ newyork Session Forecast →
Written by
Trade Together Research
Trade Together Research is a professional market analysis team providing forex, gold, and crypto trading insights, technical analysis, and educational guides.. Learn more about our research team on the About page.