NASDAQ -100 Technical Analysis Today – Wednesday, March 18, 2026: 4H Support Reaction and 1H Structure Shift in Focus
Wed Mar 18 2026
More analysis for this pair:
View all NASDAQ market analysis →Forex forecast for this pair:
View NASDAQ forecast →Market Context
The Nasdaq-100 Index remains a focal point for global market participants as technology-heavy equities continue to influence broader risk sentiment. Recent price activity shows the index revisiting a historically reactive support region on the higher timeframe, followed by a notable structural development on the lower timeframe.
This interaction between higher-timeframe support and lower-timeframe structure shifts often becomes an important area of observation for market participants evaluating potential momentum transitions.
Higher Timeframe Structure: 4H Support Zone Reaction
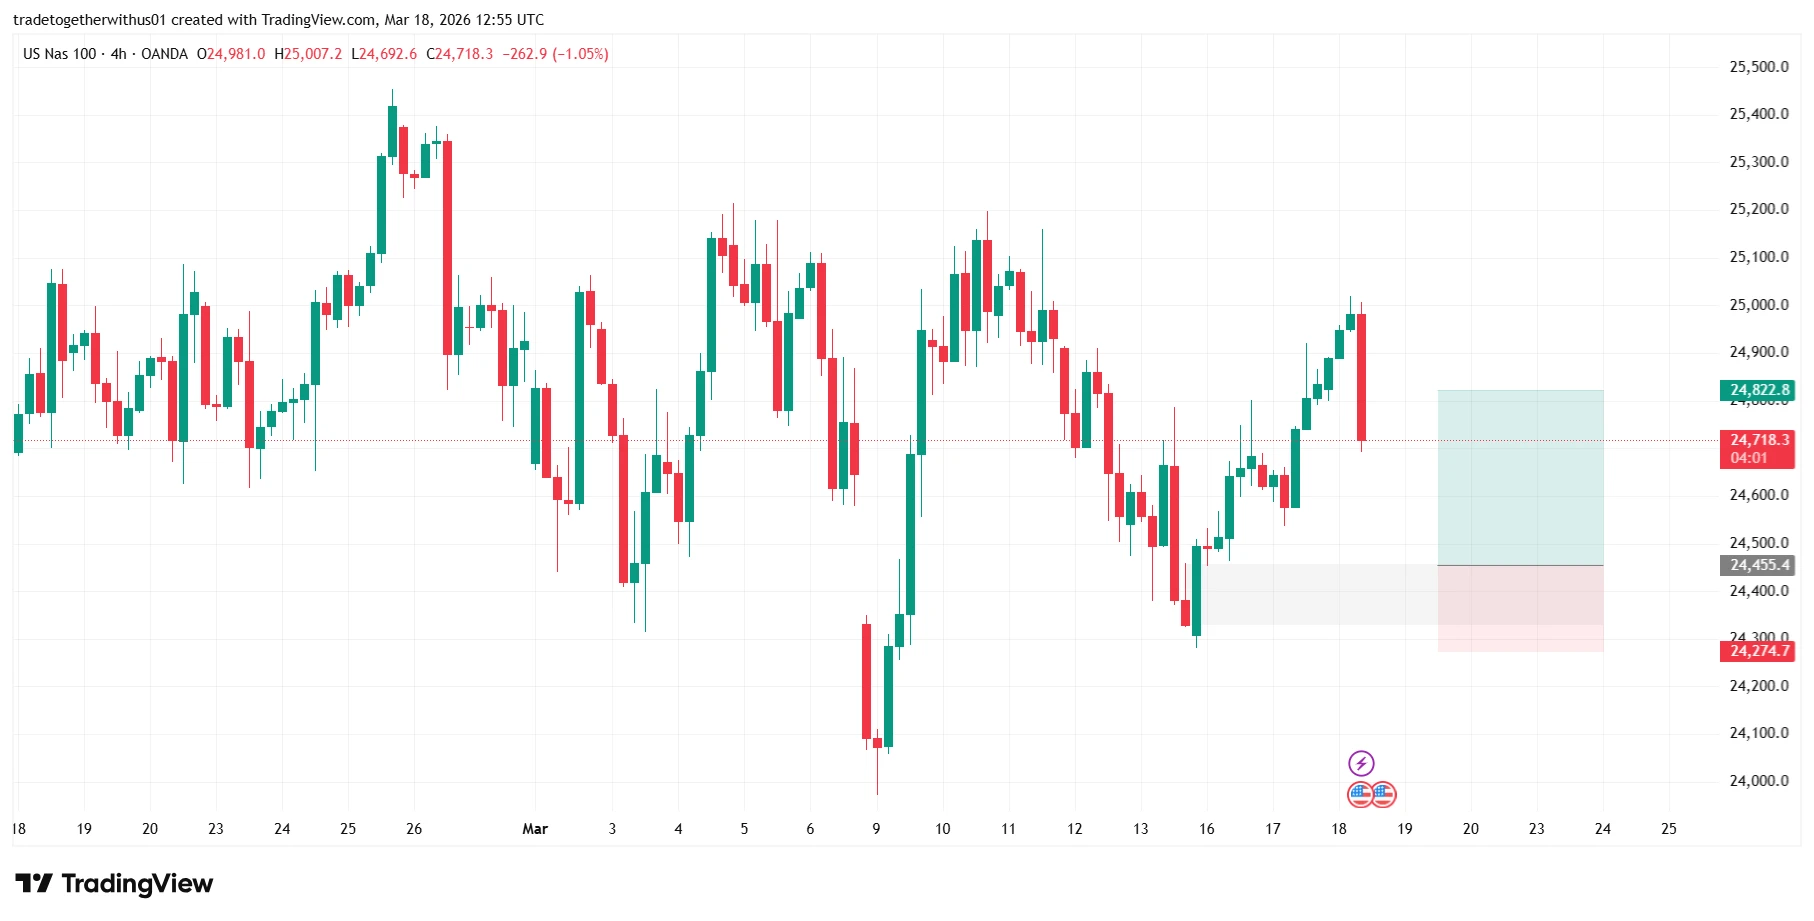
On the 4-hour timeframe, price recently revisited a key structural demand area between:
24,315.6 – 24,155.3
Historically, this region has acted as a defensive support zone, where price previously produced multiple upward reactions. Repeated interactions with a level often indicate that liquidity and market participation are concentrated within that region.
The recent reaction from this zone suggests that the area continues to hold technical relevance, with price stabilizing after testing the lower boundary of the range.
Higher timeframe support areas frequently serve as reference points where traders assess whether the broader market structure remains intact or begins transitioning toward a different directional bias.
Lower Timeframe Structure: Change of Character on the 1H Chart
When shifting to the 1-hour timeframe, the chart reveals a meaningful shift in short-term structure.
Following the reaction from the higher timeframe support region, price formed a Change of Character (ChoCH), which was subsequently followed by a Break of Structure (BoS) to the upside.
In market structure theory, this sequence may indicate that short-term bearish momentum is weakening while buyers begin to reassert control of the immediate price action. While this development does not confirm a directional outcome, it often signals that the market environment is transitioning from distribution toward potential accumulation.
Such structural changes are commonly monitored to understand how momentum evolves after a reaction from higher-timeframe zones.
Educational Breakdown of the Marked Technical Zones
The chart highlights several structural areas that help illustrate how market participants analyze price movement.
Structural Entry Observation Area
A retracement area is marked near 24,455.4, aligning with a 4H order block region where price previously showed consolidation before a strong upward movement. In structural analysis, such zones are often studied as potential areas where liquidity may re-enter the market.
Risk Boundary Zone
Below the retracement region, the chart identifies a structural invalidation area near 24,274.7. If price were to move decisively below this level, it could suggest that the short-term bullish structure observed on the lower timeframe is weakening.
Upside Liquidity Objective
On the upside, the chart highlights a projected structural region near 24,822.8, representing an area where previous price activity suggests potential liquidity or resistance.
These zones should be viewed as educational structural references, illustrating how traders map potential reactions rather than deterministic outcomes.
Alternative Market Scenarios
Markets rarely move in a single predictable direction. Several potential scenarios may unfold depending on how price behaves around the highlighted zones.
Continuation Scenario
If price stabilizes within the marked retracement region and maintains the recently formed bullish structure, the market could attempt to revisit higher liquidity zones near the upper boundary of the range.
Invalidation Scenario
A decisive move below the structural risk boundary may indicate that the recent structural shift fails to sustain momentum, potentially reopening the path toward the lower support region.
Consolidation Scenario
Markets may also transition into a sideways consolidation phase, particularly if liquidity builds between the retracement area and nearby resistance levels. Such behavior is common after sharp directional impulses.
What Market Participants May Watch Next
Going forward, several technical elements could remain important:
- Price behavior around the 4H order block region
- Whether the 1H bullish structure remains intact
- Reactions near the upper liquidity zone around 24,822
- Volume and momentum characteristics during any retracement
These observations can help provide further clues regarding whether the current structural shift evolves into a broader directional move or remains part of a wider consolidation phase.
Key Learning Takeaway
This chart provides a clear educational example of how multi-timeframe analysis can be applied to market structure.
The process typically involves:
- Identifying higher-timeframe support or demand zones.
- Observing momentum shifts on lower timeframes.
- Mapping structural reaction zones and potential liquidity areas.
Regardless of the eventual market outcome, this framework demonstrates how traders combine higher-timeframe context with lower-timeframe confirmation to interpret evolving market conditions.
Explore more analysis from this trading session:
View all newyork Session Analysis →Explore more forex forecasts and market outlooks:
View Forex Forecast Hub →Forex forecast for this session:
View NASDAQ newyork Session Forecast →
Written by
Trade Together Research
Trade Together Research is a professional market analysis team providing forex, gold, and crypto trading insights, technical analysis, and educational guides.. Learn more about our research team on the About page.