NASDAQ Analysis Today – September 7, 2026: 1H Resistance Rejection and 5M Market Structure
Mon Sep 07 2026
More analysis for this pair:
View all NASDAQ market analysis →Forex forecast for this pair:
View NASDAQ forecast →Today’s NAS100 price action provided a good example of how higher-timeframe resistance can provide context for a lower-timeframe trading setup.
On the 1-hour chart, a clearly marked resistance level repeatedly attracted selling pressure. Price reacted from this area several times, showing that the level was being respected by the market.
When price approached the same resistance area again, sellers once more became active. This was followed by a strong bearish move, with several large red candles pushing NAS100 lower.
Rather than immediately entering on the bearish move, the next step was to move to the 5-minute timeframe and wait for the market structure to provide additional information.
Market Context
The key reference point was the red horizontal resistance line on the 1-hour chart.
Price had already demonstrated multiple reactions from this area. That made the level important from a price-action perspective because it showed repeated rejection rather than being a newly identified level.
On the latest test, price again failed to sustain movement above the resistance zone.
The rejection was followed by a strong downside move, indicating that selling momentum had increased after the resistance reaction.
The important point here is that the resistance level was not treated as an automatic short signal. Instead, it provided higher-timeframe context for what happened next.
NAS100 Bias and Market Structure
After the rejection from the 1-hour resistance, the immediate short-term structure became bearish.
However, the subsequent price action on the 5-minute chart became more interesting.
Instead of simply chasing the initial bearish move, the analysis focused on whether the lower timeframe would show a meaningful change of character (ChoCH).
The 5-minute chart subsequently showed a structural shift, followed by a strong upward move from the marked liquidity area.
This is where the two-timeframe approach became useful:
- 1H: Identified the important resistance and the major reaction.
- 5M: Used for observing the developing market structure.
- Liquidity area: Provided the location for the potential entry.
- Change of Character: Provided additional confirmation of the short-term shift.
- Price action: Was used to assess whether the move had sufficient momentum.
This approach avoids relying on a single candle or indicator in isolation.
Price Levels
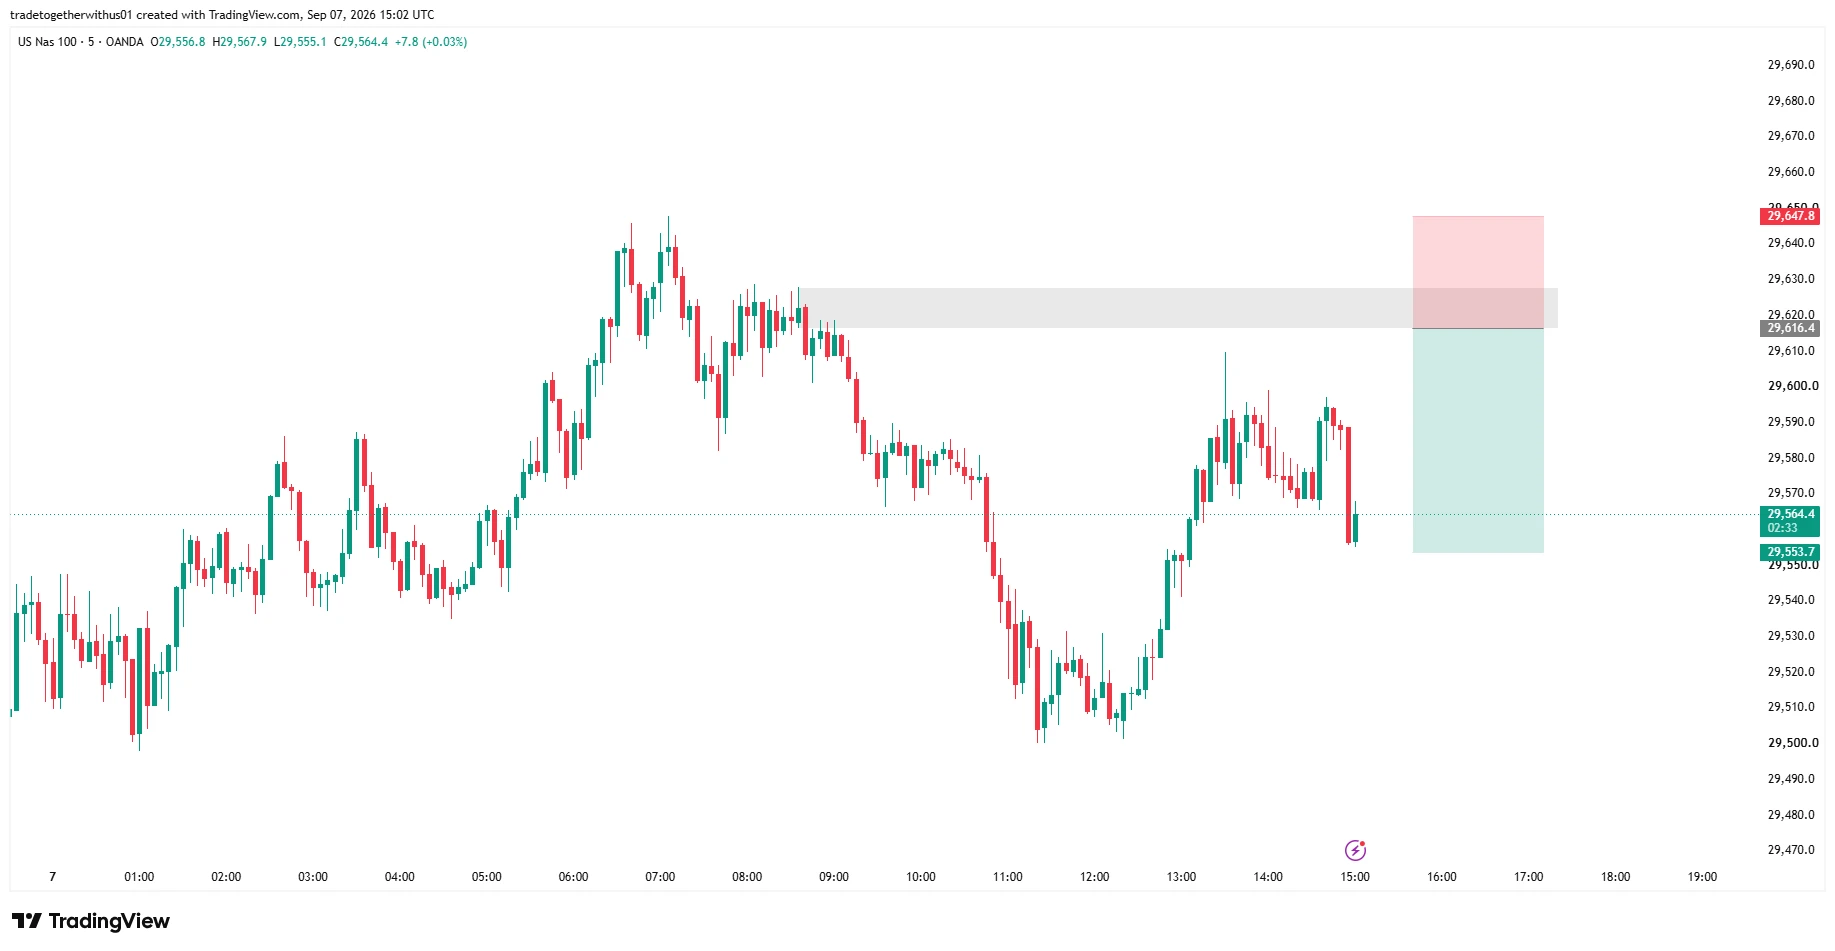
- Primary level: 29,616.4
- Risk level: 29,647.8
- Objective level: 29,553.7
The chart shows the defined risk and reward area around these levels, with the setup positioned below the higher-timeframe resistance zone.
NAS100 5-Minute Setup Logic
After the strong bearish move from the 1-hour resistance, attention shifted to the 5-minute chart.
A liquidity area was identified around the lower portion of the developing structure. Price interacted with this area before the market showed a change of character.
The subsequent bullish displacement provided the confirmation needed for the entry considered in this setup.
The trade was therefore based on a sequence rather than simply:
Resistance → buy/sell immediately.
The sequence was closer to:
1H resistance → strong rejection → bearish expansion → 5M liquidity area → change of character → entry
This distinction is important because a higher-timeframe resistance level establishes context, while the lower timeframe can help define the actual execution structure.
Why the Liquidity Area Mattered
Liquidity is an important part of price-action analysis because areas around previous highs and lows can attract significant market activity.
In this setup, the marked area became important after the initial bearish movement.
Rather than assuming that every liquidity sweep would result in a reversal, the setup waited for structural evidence.
The change of character was therefore an important component of the analysis.
A liquidity area by itself does not guarantee a reversal. The market still needs to demonstrate a change in behaviour.
Key Takeaway
The main lesson from today’s NAS100 setup is the importance of combining timeframes rather than treating one level as an isolated signal.
The 1-hour chart provided the broader context through repeated resistance reactions. The strong bearish response showed that sellers were active around the level.
The 5-minute chart then provided the opportunity to study the subsequent market structure. After price interacted with the marked liquidity area and produced a change of character, the bullish move offered the entry framework.
The complete process can be summarized as:
Higher-timeframe level → market reaction → lower-timeframe structure → liquidity → confirmation → controlled execution.
This type of framework can help traders understand why a setup exists rather than simply following an entry signal.
Explore more analysis from this trading session:
View all newyork Session Analysis →Explore more forex forecasts and market outlooks:
View Forex Forecast Hub →Forex forecast for this session:
View NASDAQ newyork Session Forecast →
Written by
Trade Together Research
Trade Together Research is a professional market analysis team providing forex, gold, and crypto trading insights, technical analysis, and educational guides.. Learn more about our research team on the About page.