USDJPY 1H Technical Analysis — April 14, 2026 (Tuesday)
Tue Apr 14 2026
More analysis for this pair:
View all USDJPY market analysis →Forex forecast for this pair:
View USDJPY forecast →Market Context
The USD/JPY pair continues to trade within a broader corrective phase after an earlier bullish push. Recent price action shows increasing downside pressure as momentum shifts toward sellers in the short term. On the 1-hour timeframe, the market structure reveals a gradual transition from upward movement into a controlled bearish sequence of lower highs and lower lows.
The current price interaction with a previously defined structural zone provides an interesting technical context, where market participants are observing whether the pair stabilizes temporarily or extends the ongoing downward move.
Higher Timeframe Structure Overview
From a broader perspective, USD/JPY remains within a larger directional structure where bullish momentum dominated earlier sessions, but the latest movement reflects a retracement phase.
Several characteristics define the current environment:
- Gradual formation of lower highs on the intraday structure
- Increasing selling pressure following a distribution phase
- Price moving toward previously established liquidity areas
These elements suggest the market is currently testing structural support zones formed during earlier institutional activity.
While the broader trend context remains important, the 1-hour timeframe now shows signs of momentum transition, which often precedes short-term continuation moves or consolidation periods.
Current Chart Structure and Key Observations
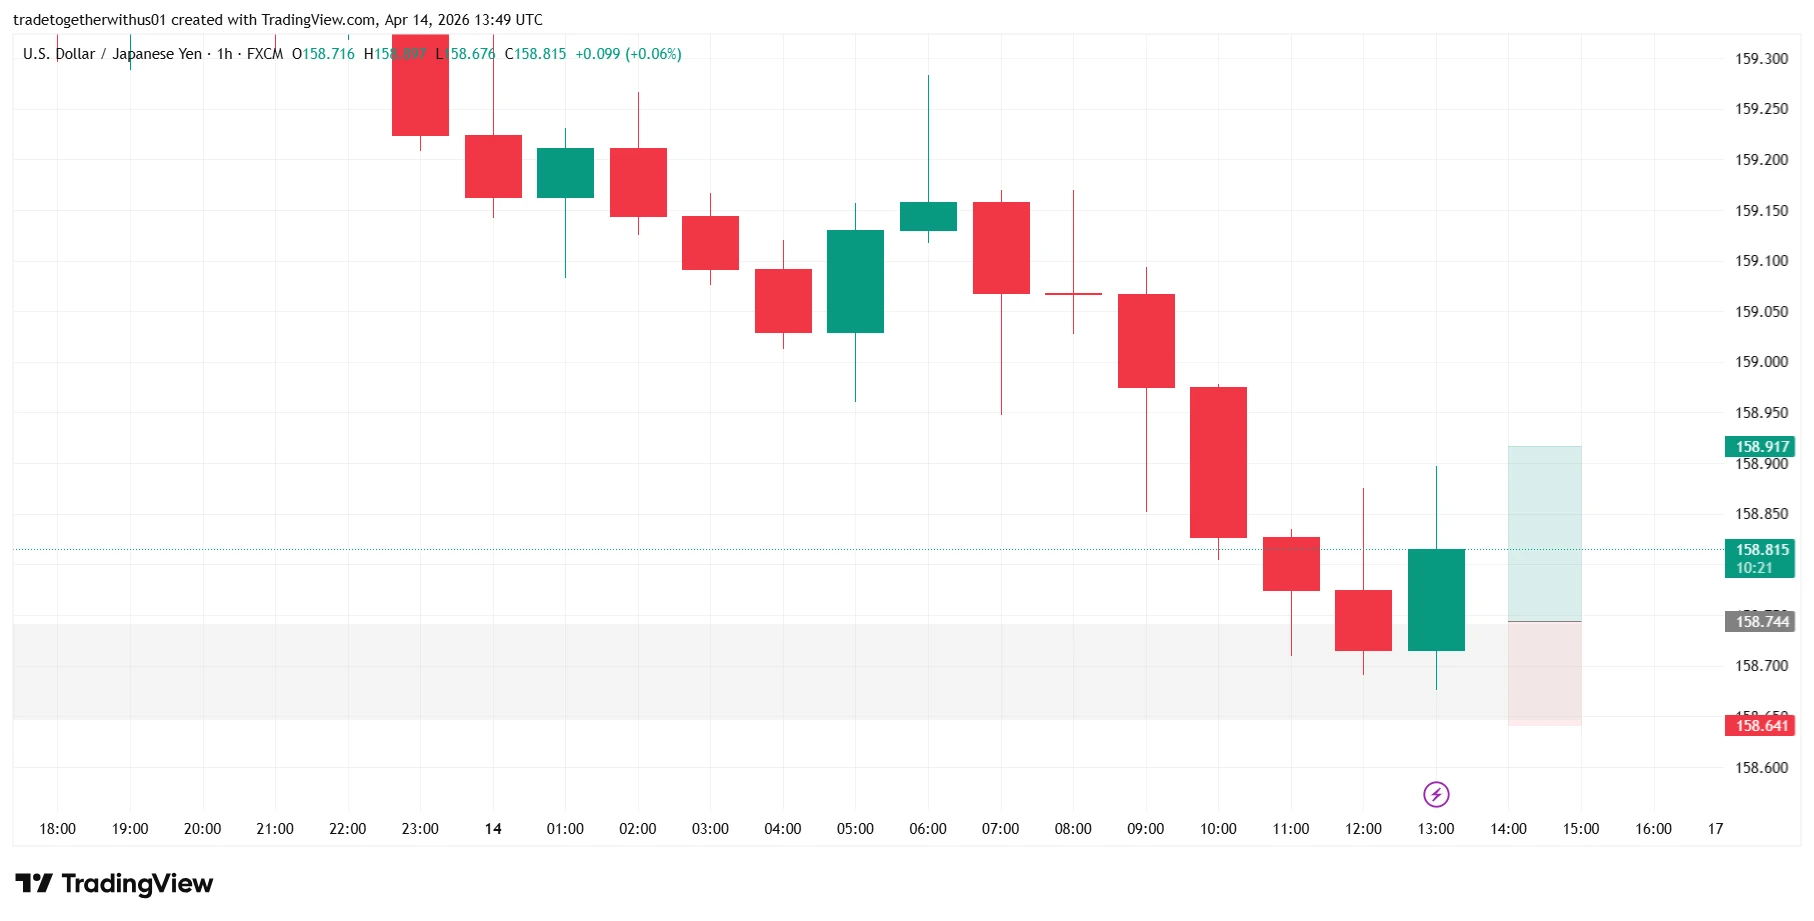
The chart highlights a previous order block region combined with a volume concentration area, forming a structural zone where the market historically reacted.
Key technical observations include:
- Price revisited the order block zone identified on the 1H timeframe
- The area aligns with volume concentration within the structure
- A 5-minute change of character (ChoCH) appeared after price entered the zone
- Momentum temporarily shifted following the structural reaction
The reaction occurred within the defined structural range between 158.740 and 158.744, suggesting the area still holds technical relevance for market participants monitoring liquidity interactions.
Educational Explanation of the Marked Zones
The chart includes three important structural areas:
Upper Structural Boundary — 158.744
This level represents the upper structural boundary of the reaction zone identified within the order block and volume cluster. When price revisits areas where strong participation previously occurred, analysts often monitor how the market behaves near the upper portion of the zone.
Such levels can provide insight into whether liquidity within the structure is still influencing short-term price movement.
Lower Structural Boundary — 158.641
This level forms the lower structural boundary of the highlighted zone. Movement beyond this level may indicate that the reaction area is losing influence within the current market structure.
In structural analysis, the lower edge of a zone often helps define whether price continues respecting the area or begins transitioning toward deeper liquidity levels.
Nearby Liquidity Reference Level — 158.917
This level corresponds with a nearby liquidity reference area created by earlier price activity. Markets often move toward such levels as they rebalance liquidity within the intraday structure.
These regions frequently align with prior highs, consolidation zones, or short-term liquidity pools.
What Market Participants Should Watch Next
Several technical factors may shape the next phase of USD/JPY price action:
- Stability of price within the identified reaction zone
- Additional momentum shifts on lower timeframes
- Formation of new liquidity areas above or below the current range
- Interaction with recent intraday highs and lows
Monitoring these structural developments can provide insight into whether the market is preparing for continuation, consolidation, or further correction.
Learning Takeaway
This chart highlights several valuable lessons about market structure:
-
Order blocks often act as important reaction zones.
-
Volume concentration areas help identify meaningful price levels.
-
Lower-timeframe momentum shifts can provide confirmation of reactions within higher-timeframe zones.
-
Markets frequently move between liquidity areas rather than traveling in straight lines.
Understanding these concepts allows traders to interpret price movements as part of an evolving structural process rather than isolated events.
Explore more analysis from this trading session:
View all newyork Session Analysis →Explore more forex forecasts and market outlooks:
View Forex Forecast Hub →Forex forecast for this session:
View USDJPY newyork Session Forecast →
Written by
Trade Together Research
Trade Together Research is a professional market analysis team providing forex, gold, and crypto trading insights, technical analysis, and educational guides.. Learn more about our research team on the About page.