USDJPY 1H Technical Analysis – April 21, 2026: Institutional Zone Reaction.
Tue Apr 21 2026
More analysis for this pair:
View all USDJPY market analysis →Forex forecast for this pair:
View USDJPY forecast →Market Context
The USD/JPY currency pair is one of the most liquid instruments in the global foreign exchange market. Movements in this pair are often influenced by interest rate expectations, monetary policy divergence, and global risk sentiment, which makes it particularly responsive to shifts in market liquidity.
Because of this deep liquidity, USD/JPY frequently forms clear structural movements and technical reactions around previously active price zones. Observing how price behaves when revisiting these zones can provide valuable insight into how market participants interact with liquidity.
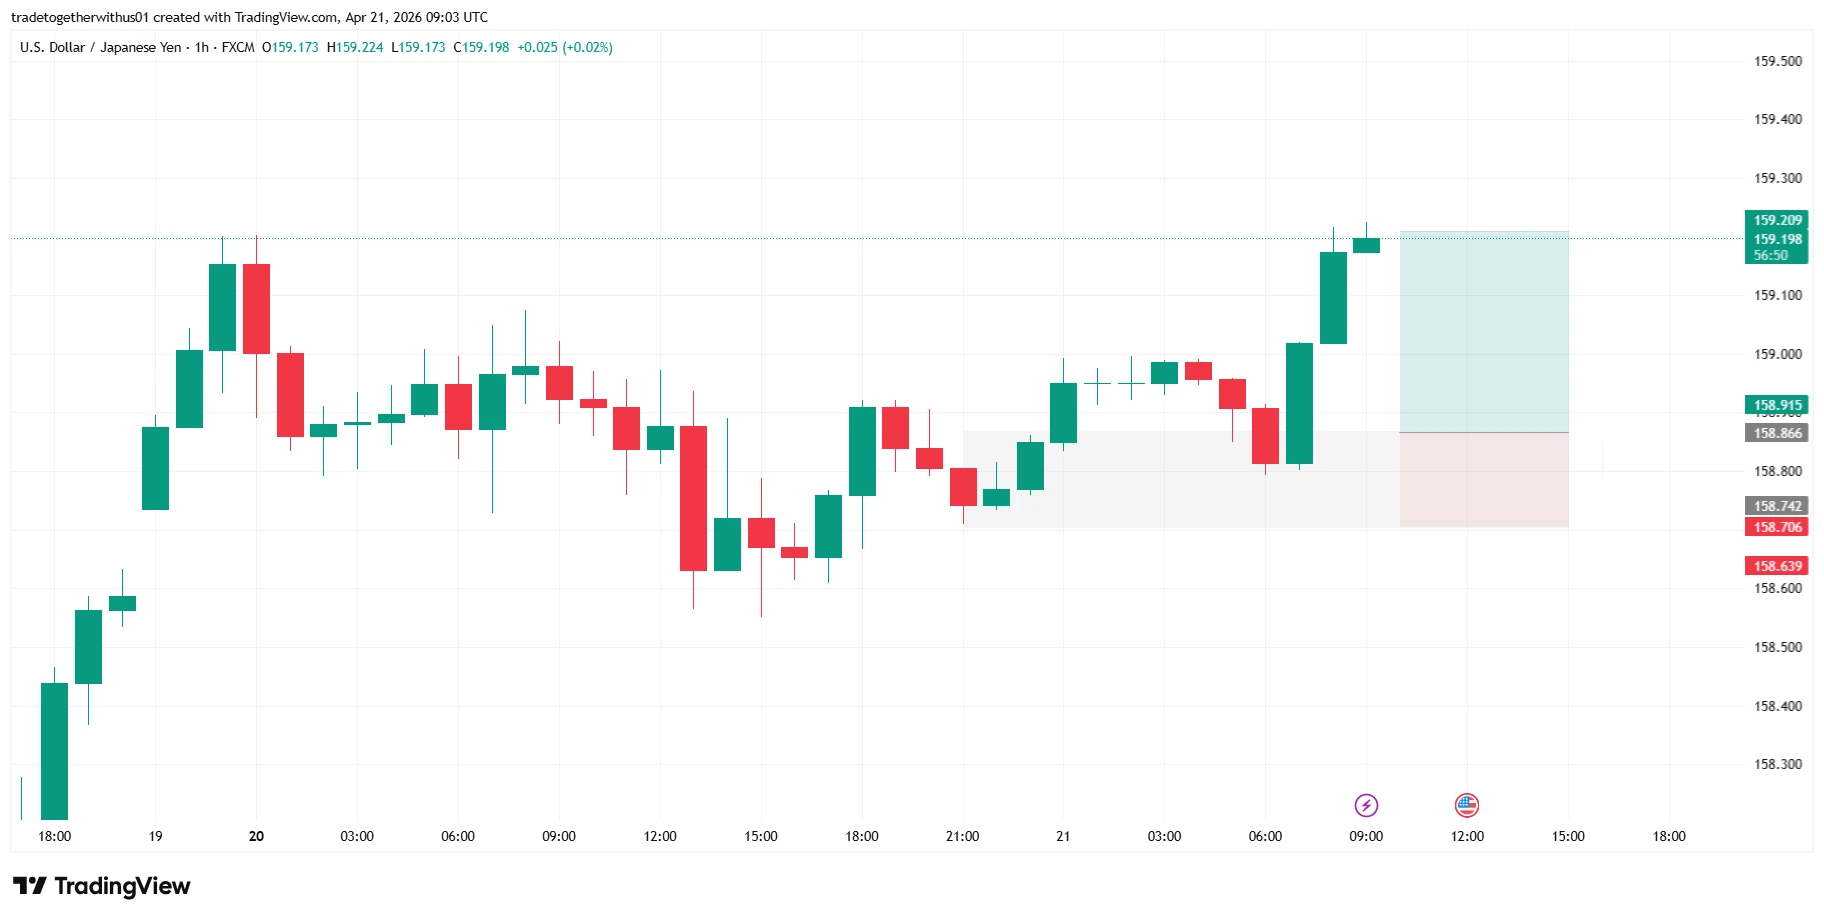
The chart on the 1-hour timeframe highlights an example of price reacting from a previously established structural area, followed by a notable expansion in momentum. Rather than interpreting this as a directional call, the chart serves as an educational illustration of how institutional price zones, imbalance areas, and lower-timeframe structure shifts can align.
Understanding these dynamics helps traders study how liquidity flows through the market over time.
Higher Timeframe Structure Context
Professional market analysis usually begins by understanding the broader structural environment before focusing on lower timeframes.
Prior to the movement highlighted on the chart, USD/JPY displayed several characteristics often seen during market transitions:
- A temporary corrective phase
- Overlapping candles suggesting short-term consolidation
- Price revisiting a previously active demand region
These environments frequently occur when the market is rebalancing liquidity after a previous impulse move.
In many cases, price revisits earlier areas where strong participation occurred. These areas often include:
- Institutional order block regions
- Fair value gaps created by rapid price movements
- Liquidity clusters around previous swing highs and lows
When price returns to these zones, reactions can occur as the market absorbs liquidity and redistributes orders.
Current 1H Chart Structure and Key Observations
On the 1-hour USD/JPY chart, price revisits a previously active structural region where strong momentum originated earlier.
The chart reveals several important observations:
-
Price retraced toward a previously active demand zone.
-
The market reacted around this structural level.
-
Momentum began to expand shortly after the reaction.
-
Price continued moving upward toward higher liquidity areas.
From a structural standpoint, this type of behavior often reflects a reaction-expansion sequence, where the market revisits a key zone before continuing toward nearby liquidity targets.
Such patterns are common when markets rebalance inefficiencies created during earlier impulsive movements.
Understanding the Highlighted Structural Zones
The chart highlights several important areas that help explain how price developed after the reaction.
Structural Reaction Zone
The first highlighted region represents an area where price revisited a previously active institutional zone.
These areas often form when strong directional movements originate from a specific candle or cluster of candles. The rapid nature of such moves can leave behind price imbalances, also known as fair value gaps.
When the market later returns to these regions, participants often observe whether price:
- Shows signs of renewed participation
- Stabilizes temporarily
- Begins developing a new directional impulse
Such reactions often reflect liquidity absorption and rebalancing within the market.
Structural Invalidation Area
Below the reaction zone lies an important structural boundary, representing a level where the prior market idea would become weaker if breached.
In many technical frameworks, this area aligns with:
- A previous swing low
- The point where the structural reaction would no longer hold
- A shift in short-term market control
Identifying such areas is a core component of disciplined market analysis because markets operate in probabilities rather than certainty.
Upper Liquidity Zone
The higher highlighted area represents a liquidity cluster above recent price activity.
Markets often gravitate toward areas where:
- Previous highs exist
- Stop orders accumulate
- Pending orders create liquidity pools
When price begins expanding after reacting from a structural zone, these upper areas frequently become potential destinations where liquidity may be collected.
However, such zones should always be viewed as areas of interest rather than predetermined outcomes.
What Market Participants May Watch Next
Following such structural reactions, analysts typically monitor several evolving factors:
- Whether momentum remains sustained
- How price behaves near recent highs
- Development of new imbalance zones
- Formation of higher lows or consolidation structures
These observations help participants understand how liquidity continues to flow through the market.
Key Learning Takeaway
This chart provides a practical example of how several technical concepts can align within a single market movement:
- Institutional price zones
- Order block reactions
- Fair value gap rebalancing
- Short-term momentum shifts
Instead of attempting to predict markets with certainty, traders can focus on understanding how price transitions between liquidity zones.
Developing this perspective encourages probability-based thinking, patience, and disciplined risk management.
Explore more analysis from this trading session:
View all london Session Analysis →Explore more forex forecasts and market outlooks:
View Forex Forecast Hub →Forex forecast for this session:
View USDJPY london Session Forecast →
Written by
Trade Together Research
Trade Together Research is a professional market analysis team providing forex, gold, and crypto trading insights, technical analysis, and educational guides.. Learn more about our research team on the About page.