USDJPY Price Analysis — March 10–12, 2026: Liquidity Sweep Near Resistance Signals Key Structural Test on 1-Hour Chart
Tue Mar 10 2026
More analysis for this pair:
View all USDJPY market analysis →Forex forecast for this pair:
View USDJPY forecast →Market Context
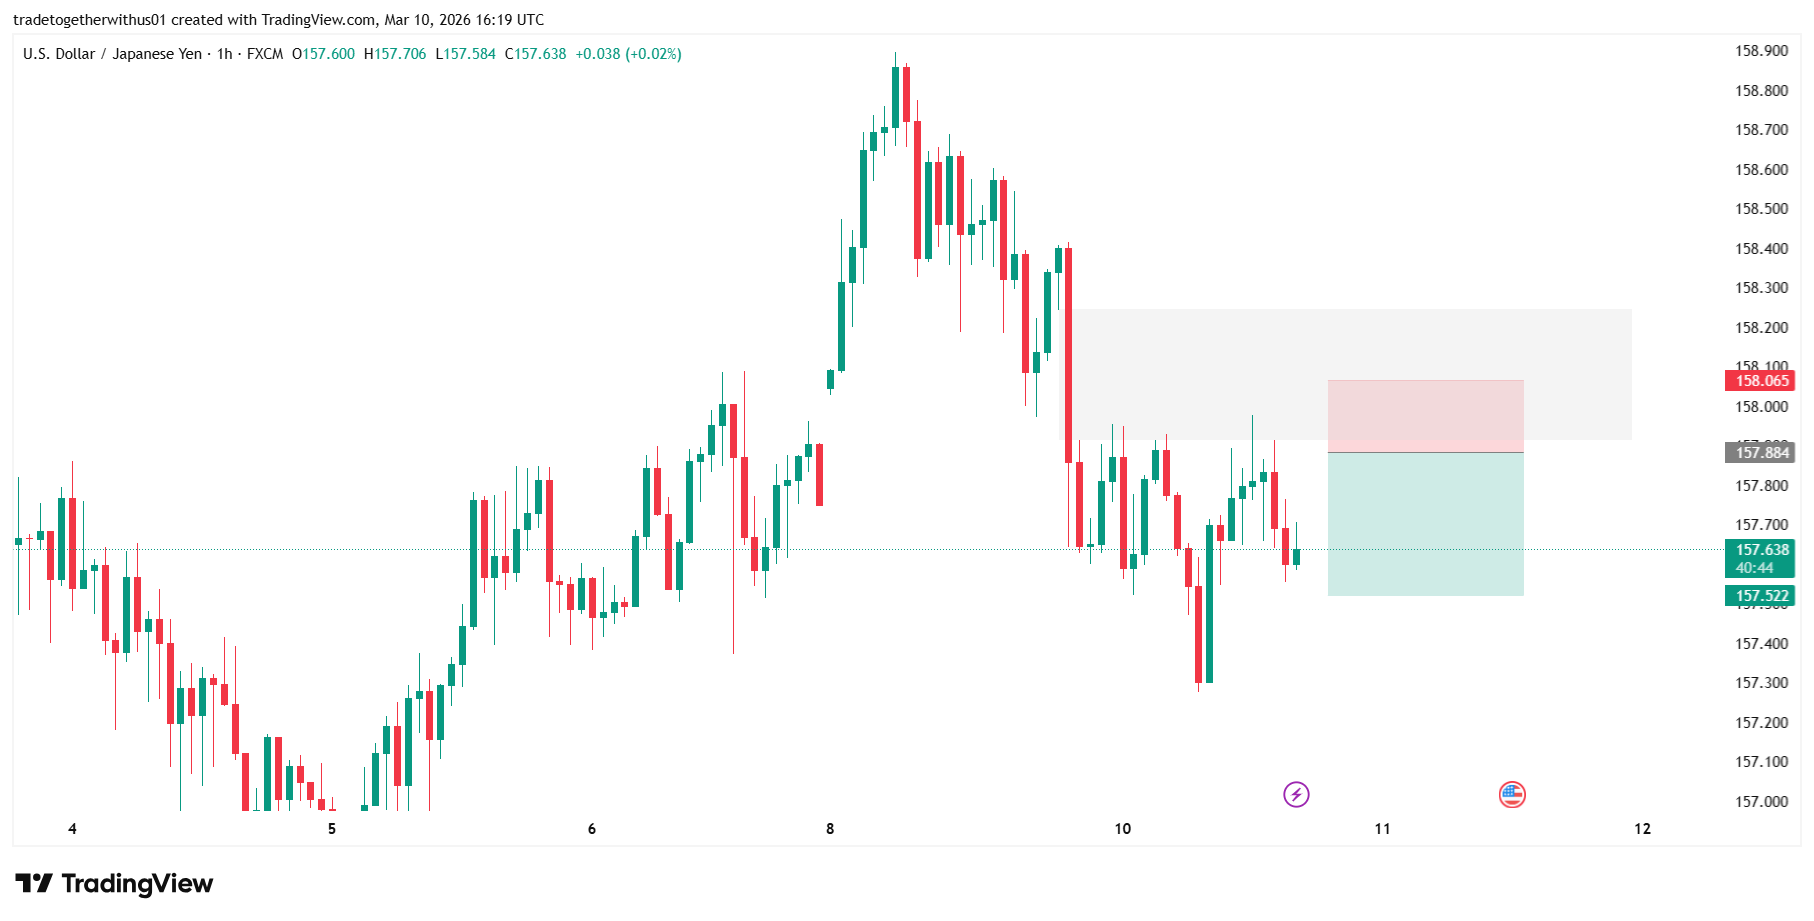
The USD/JPY currency pair recently displayed notable price interaction around a previously respected resistance area on the 1-hour timeframe.
Price briefly moved above a structural high before quickly rotating lower, suggesting that liquidity resting above the level may have been triggered. Such behavior is common in foreign exchange markets where price temporarily breaches technical levels before revealing the next directional phase.
The current structure provides a useful educational example of how liquidity sweeps, resistance zones, and lower-timeframe momentum shifts can interact within a short-term market environment.
Structural Context Visible on the Chart
Within the visible structure on the 1-hour chart, price approached a previously reactive level that had rejected advances multiple times in the past.
Several technical characteristics stand out:
- A bearish order block structure formed from a strong red candle followed by a fair value gap.
- Inside this zone, a high-volume reaction area appears near the midpoint of the order block.
- Price temporarily moved above the upper boundary of the structure, forming a liquidity sweep through the wick.
- Shortly afterward, momentum shifted downward.
These developments indicate that the market tested liquidity above resistance before reacting lower.
Momentum Shift on the Lower Timeframe
After the liquidity sweep occurred, the market began showing early signs of structural weakness.
On the 5-minute timeframe, price printed a downside change of character (ChoCh), which is commonly interpreted as an early signal that short-term momentum may be shifting.
Lower timeframe structural shifts often occur when markets transition between phases such as:
- exhaustion after a liquidity grab
- short-term distribution
- rotational movement toward nearby support areas
In this case, the structural change followed directly after the sweep above resistance, making the sequence technically noteworthy.
Educational Explanation of the Marked Zones
The chart highlights three structural regions that help explain the market behavior.
Upper Structural Boundary (Red Zone)
The upper highlighted region represents the structural ceiling of the analyzed setup.
This area sits above:
- the order block high
- the liquidity sweep wick
- the historically reactive resistance level
In technical analysis, such zones often act as structural invalidation boundaries. Sustained price acceptance above this region could suggest that the earlier downside reaction lacked follow-through.
Central Reaction Zone
The mid-level highlighted area represents a reaction zone located inside the order block and near the high-volume level.
This region becomes technically relevant because it combines several elements:
- proximity to a previously respected resistance level
- interaction with an institutional supply zone
- alignment with the lower-timeframe momentum shift
Markets frequently reassess direction in areas where multiple technical factors converge.
Lower Structural Support Reference (Green Zone)
The lower highlighted region represents a downside reference zone where price previously showed reaction.
This area corresponds with:
- earlier consolidation activity
- a nearby liquidity pocket
- intraday support behavior on the chart
If price continues rotating lower, such zones often become areas where the market pauses, reacts, or consolidates before the next move develops.
Alternative Market Scenarios
Because financial markets are probabilistic, several outcomes remain possible from the current structure.
Scenario 1 — Continued Downside Rotation
If the resistance structure around 157.95–158.00 continues to hold, price could maintain downward rotation toward nearby structural support zones.
This scenario would remain consistent with:
- the liquidity sweep above resistance
- the 5-minute change of character
- rejection from the order block region
Scenario 2 — Reclaim of the Resistance Zone
If the market establishes sustained acceptance above the upper structural boundary, the previous rejection may prove temporary.
Such behavior could indicate that the earlier sweep functioned as a liquidity collection before further upside exploration.
Scenario 3 — Short-Term Consolidation
Markets often pause after liquidity sweeps.
In this case, USD/JPY may temporarily develop a consolidation range between the resistance region and lower support levels before a clearer directional move emerges.
Range development frequently precedes stronger directional expansion.
What Market Participants May Watch Next
Several technical factors may help clarify the next phase of the market:
- Whether price maintains rejection near 157.95 resistance
- Development of additional lower-timeframe structural shifts
- Price interaction with the lower structural support zone
- Volatility associated with macro-economic catalysts affecting USD or JPY
Monitoring how price behaves around these areas can provide valuable insight into the evolving structure.
Learning Takeaway
This chart demonstrates a common market behavior:
Liquidity sweeps near major resistance zones often occur before momentum shifts become visible.
For educational purposes, traders can observe how:
- order block structures interact with resistance levels
- liquidity sweeps precede directional movement
- lower-timeframe structural shifts provide early clues about market momentum
Understanding these dynamics can help improve market structure interpretation regardless of the eventual outcome.
Explore more analysis from this trading session:
View all newyork Session Analysis →Explore more forex forecasts and market outlooks:
View Forex Forecast Hub →Forex forecast for this session:
View USDJPY newyork Session Forecast →
Written by
Trade Together Research
Trade Together Research is a professional market analysis team providing forex, gold, and crypto trading insights, technical analysis, and educational guides.. Learn more about our research team on the About page.