USDCAD 1H Analysis – Monday, March 16, 2026: Price Reacts to Key Structural Resistance Zone
Mon Mar 16 2026
More analysis for this pair:
View all USDCAD market analysis →Forex forecast for this pair:
View USDCAD forecast →Market Context
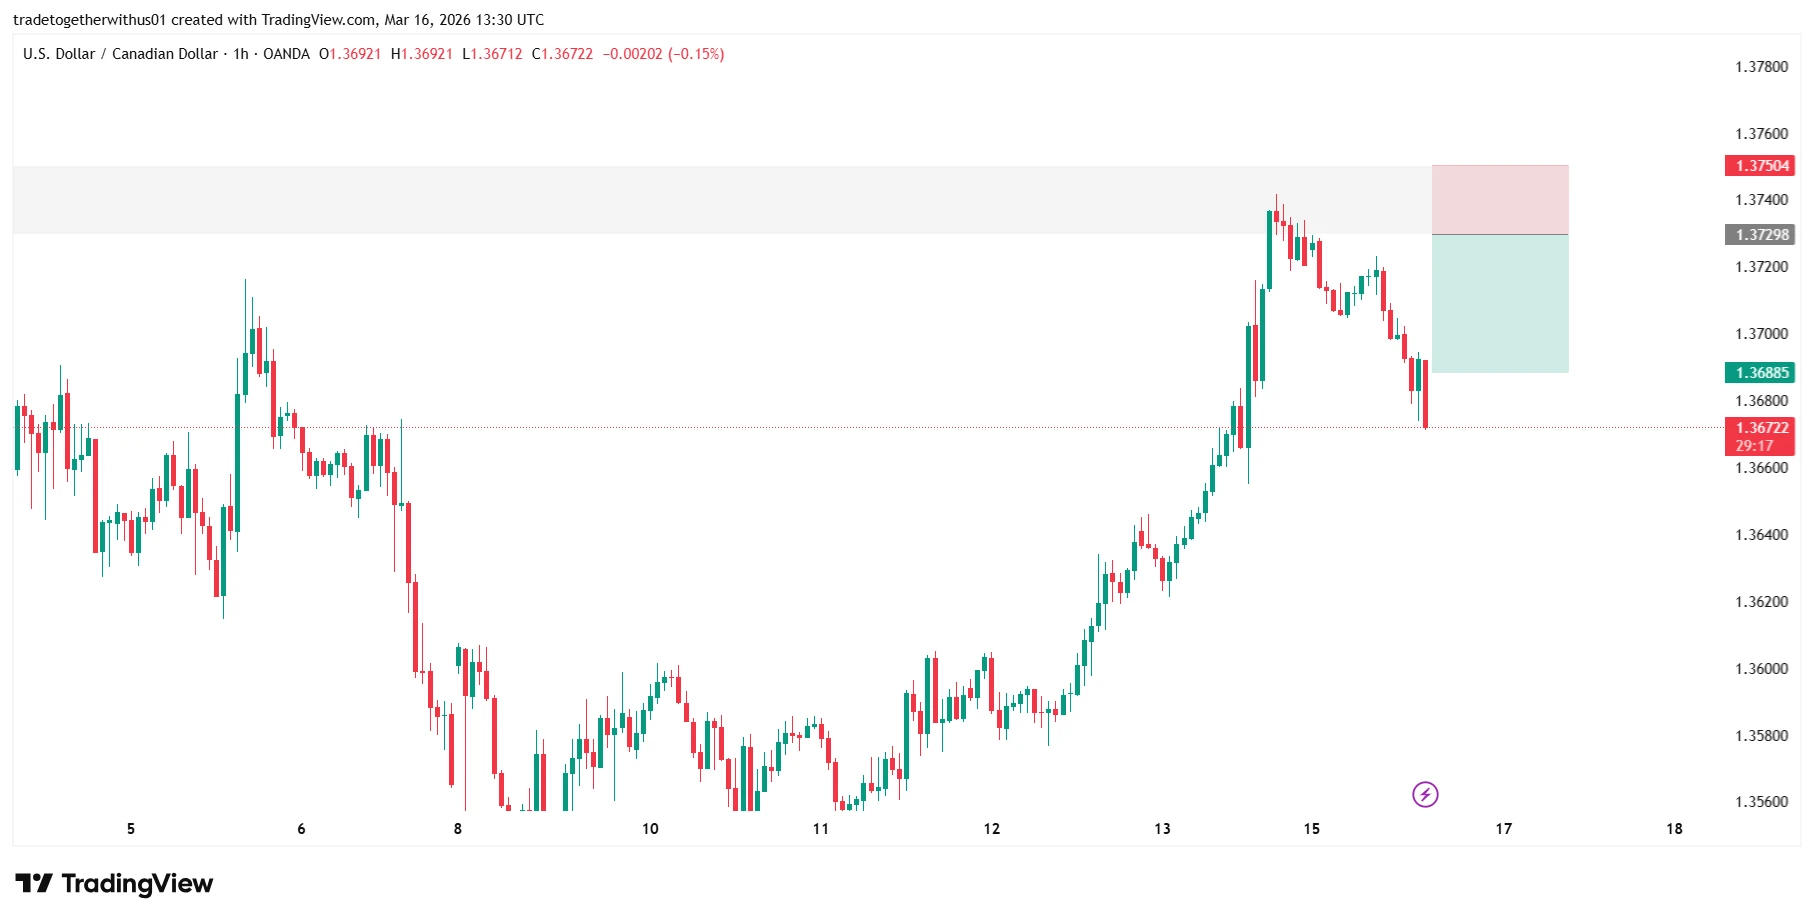
The USDCAD pair has recently shown strong upward momentum after forming a base earlier in the week. However, as price approached a previously tested structural zone on the 1-hour timeframe, market behavior began to shift, suggesting a possible change in short-term momentum.
The current chart highlights an important area where price previously reacted multiple times, making it a technically significant zone for observing future price behavior.
Higher Timeframe Structure
From a broader perspective, USDCAD experienced a notable upward move following a period of consolidation. This impulsive move established a series of higher highs and higher lows, indicating a short-term bullish phase.
However, once price approached the 1.37300–1.37500 region, upward momentum began to weaken. This area appears to act as a structural resistance zone where previous market reactions occurred, suggesting that liquidity and order flow may be concentrated there.
Such zones often become areas where market participants reassess positioning.
Current Chart Structure and Key Observations
On the 1-hour chart, the market initially pushed upward with strong momentum before reaching the upper structural zone. After this approach, price began to show signs of hesitation and gradual downside pressure.
Several observations stand out:
- The upward impulse leading into the zone was relatively sharp, indicating strong participation.
- Once price entered the highlighted resistance region, momentum slowed and bearish candles began to appear.
- This shift suggests that the previously dominant bullish momentum may be encountering supply within the zone.
This kind of reaction is commonly observed when price revisits historically significant levels.
Understanding the Marked Structural Zones
The chart highlights three key technical levels:
- Structural Resistance Area: 1.37298
- Risk Boundary Zone: 1.37504
- Downside Reference Area: 1.36885
These zones are not predictive levels but rather reference areas for analyzing market behavior.
The upper region represents a historical reaction zone where price has previously encountered resistance. When price revisits such areas, market participants often observe whether momentum continues, stalls, or reverses.
The risk boundary above the zone marks a level where the structural idea behind the reaction may weaken if price establishes strength beyond it.
Meanwhile, the lower level represents a potential liquidity or reaction area where price may seek balance if downside momentum continues.
Possible Market Scenarios
Continuation Scenario
If downside pressure continues from the resistance region, price may gradually move toward the lower structural area. Such behavior would indicate that the recent bullish impulse was primarily a liquidity sweep into resistance.
Invalidation Scenario
If price establishes strength above the upper boundary, the resistance zone may lose its significance. In that case, the market could resume the broader bullish structure.
Consolidation Scenario
Another common outcome around major structural zones is sideways consolidation. In this case, price may oscillate between the marked levels as the market searches for directional clarity.
What Market Participants May Watch Next
Participants observing USDCAD may focus on several key developments:
- Whether price remains below the structural resistance zone
- Momentum behavior around the mid-range of the move
- Formation of new structural highs or lows on lower timeframes
- Volatility expansion following the recent reaction
These elements often help determine whether a reaction develops into a larger structural move.
Learning Takeaway
This chart provides a useful example of how historical reaction zones influence future market behavior. Instead of focusing solely on price direction, analyzing structure, momentum shifts, and reaction zones can provide deeper insight into market dynamics.
Even when outcomes vary, studying how price behaves around such zones helps improve understanding of market structure and liquidity flows.
Explore more analysis from this trading session:
View all newyork Session Analysis →Explore more forex forecasts and market outlooks:
View Forex Forecast Hub →Forex forecast for this session:
View USDCAD newyork Session Forecast →
Written by
Trade Together Research
Trade Together Research is a professional market analysis team providing forex, gold, and crypto trading insights, technical analysis, and educational guides.. Learn more about our research team on the About page.