USDJPY Analysis – Thursday, October 29, 2026: Key Resistance & Bearish Setup
Thu Oct 29 2026
More analysis for this pair:
View all USDJPY market analysis →Forex forecast for this pair:
View USDJPY forecast →Market Context
The USDJPY pair has experienced a sharp decline from the 158.30–158.40 region, followed by a recovery from lower levels. In the latest market structure, price has rebounded from the area around 156.20–156.80 and is trading near 157.88.
Although this recovery indicates renewed buying activity in the short term, it does not automatically establish a bullish reversal. Price is approaching a region that has repeatedly acted as both support and resistance, making the reaction around this area important for assessing the next potential move.
This analysis focuses on a possible bearish continuation following a rejection from a higher-timeframe resistance zone. The approach combines one-hour technical context with five-minute market-structure confirmation. The scenario remains conditional on how price behaves around the identified levels.
Technical Structure
The one-hour chart highlights a notable zone between approximately 158.327 and 158.436. This region has previously acted as both support and resistance, with price reacting around it on multiple occasions. Such repeated interactions make the zone relevant because the same area can influence market behaviour when price revisits it.
The zone also aligns with the order block and fair value gap (FVG) identified in the analysis. The lower blue level represents the highest-volume area within the marked order block, while the upper level corresponds to the 0.58 ATR reference used for the one-hour range.
These elements provide different forms of context. The order block identifies an area of prior price activity, the FVG highlights a price imbalance, the volume reference helps locate an area of concentrated trading activity, and the ATR measurement adds a volatility-based reference. Their overlap makes the zone worth monitoring, although confluence does not guarantee a reversal.
Price returned to this region and reacted to the downside. That reaction provided the basis for examining the five-minute chart for further evidence of a potential bearish shift.
Why This Market Scenario Is Being Considered
The analysis follows a multi-timeframe process rather than relying on the resistance zone alone.
First, the one-hour chart established the area of interest through the historical support-and-resistance zone, order block, FVG, volume reference and ATR level. The importance of the zone is reinforced by its repeated role in previous price reactions.
Second, price revisited the area and moved lower. This suggested that the zone was once again attracting selling pressure, although the initial reaction alone could not confirm whether the decline would continue.
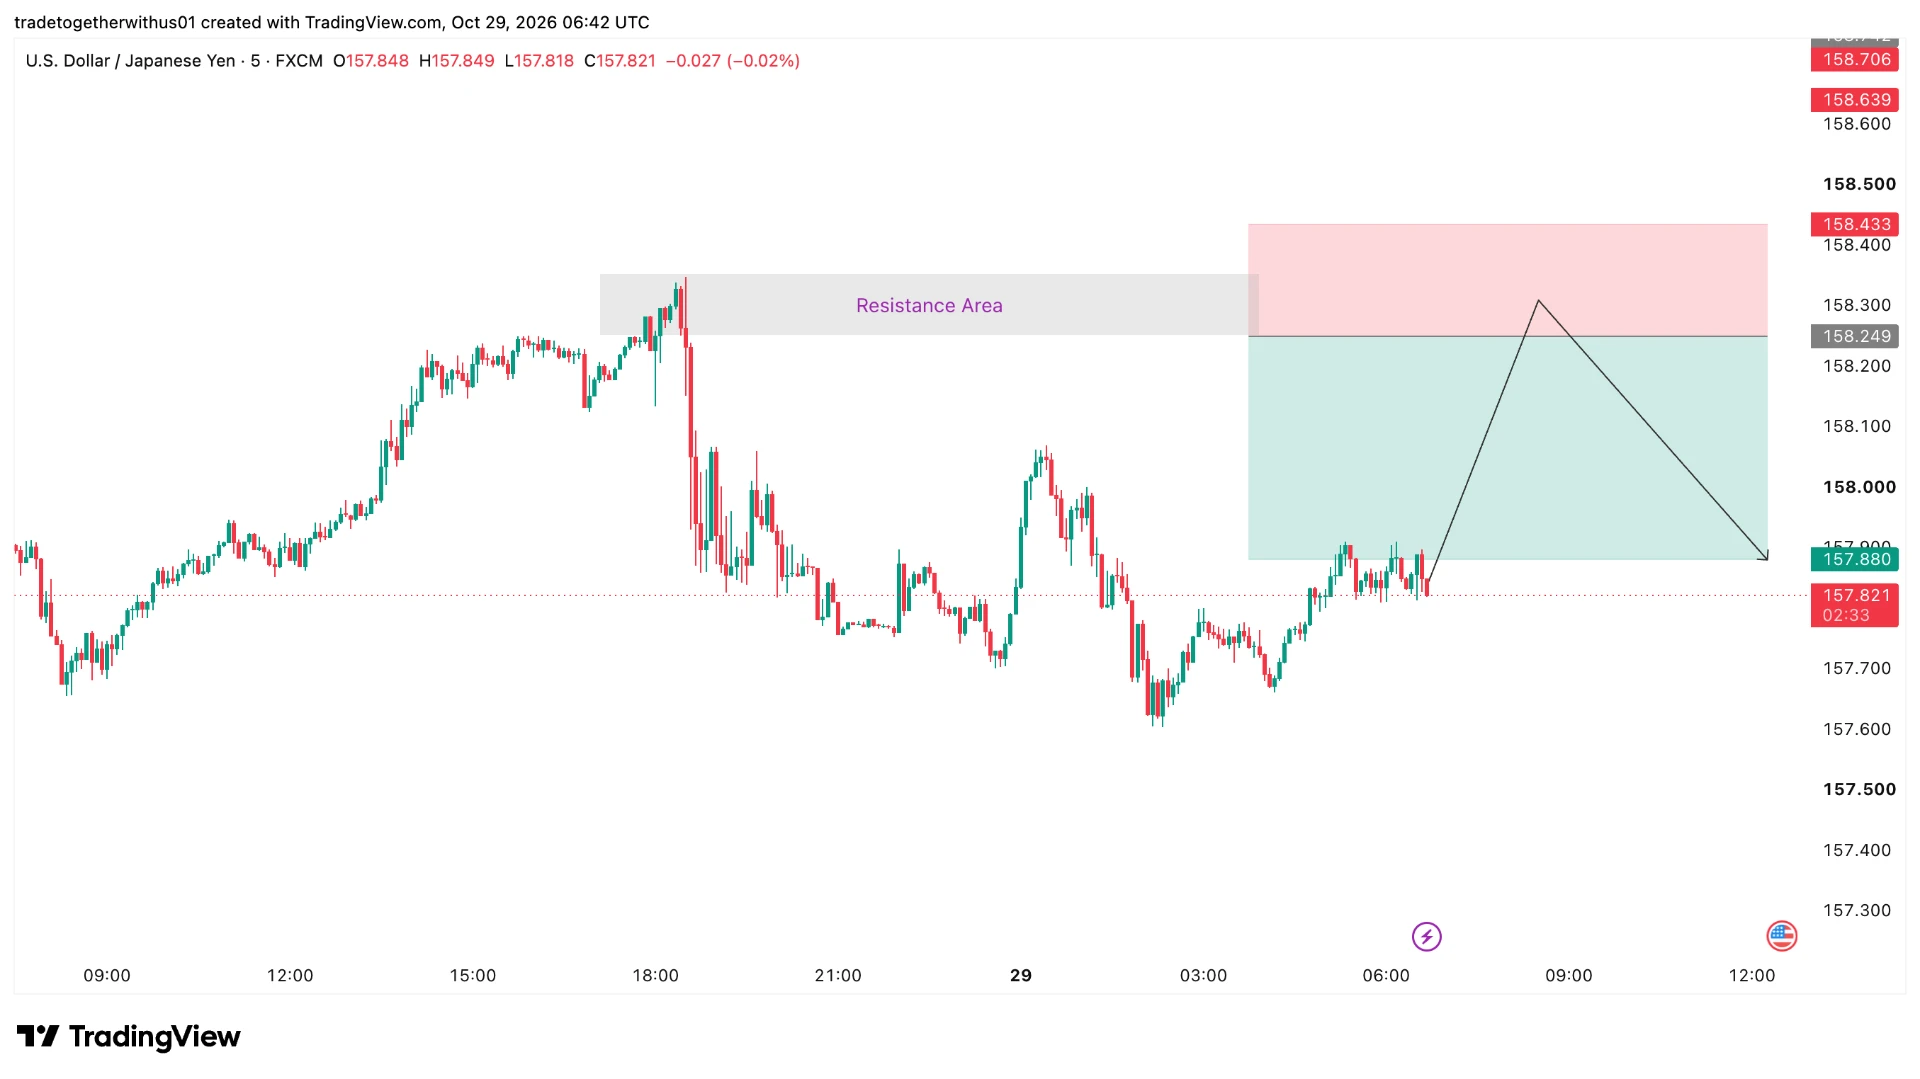
Third, the analysis shifted to the five-minute timeframe. A bearish change of character (ChoCH) appeared after the downside reaction, indicating a potential shift in short-term market structure. This lower-timeframe evidence supported the bearish interpretation and helped refine the area considered for the scenario.
The planning framework used a reference level near 158.249, an upper boundary at 158.433, and a lower objective near 157.880. These levels describe the illustrated analytical framework rather than instructions to take a position.
Potential Market Scenarios
Bearish Scenario
The bearish interpretation would strengthen if price continued to display downside structure on the five-minute chart and failed to reclaim the higher-timeframe resistance region. Continued selling pressure below the recent recovery area could support a deeper retracement.
The reference area around 157.880 is relevant to the illustrated scenario. However, price reaching a particular level is not assured, and the scenario would need to be reassessed as new price information develops.
Bullish Scenario
A sustained move back above the 158.327–158.436 region would weaken the bearish interpretation. If price reclaimed the zone and established stronger bullish structure, it would suggest that buyers were overcoming the selling pressure observed during the previous rejection.
Neutral Scenario
If price fluctuated below the resistance zone without establishing a clear directional structure, the market could remain indecisive. In that situation, the earlier rejection and subsequent recovery would need to be evaluated together rather than treating either movement as conclusive.
Key Levels and Areas to Watch
The primary area is 158.327–158.436, where historical support and resistance overlap with the technical factors identified in the one-hour analysis. The level near 158.249 is the reference used in the illustrated five-minute planning framework.
The lower area around 157.880 provides context for the potential downside scenario. Further below, the broader recent price movement around 156.20–156.80 helps describe the preceding decline and recovery.
These are reference levels for interpreting price behaviour, not guaranteed turning points. Their significance depends on how the market reacts when they are revisited.
Invalidation and Risk Considerations
A sustained recovery through the resistance zone would weaken the bearish thesis, while continued bearish five-minute structure would support it. A change in short-term structure should prompt a fresh assessment rather than an automatic continuation of the original interpretation.
USDJPY can experience sharp movements in response to changes in interest-rate expectations, economic releases and broader market sentiment. Spread changes, slippage and execution conditions may also affect trading outcomes. The illustrated 1:2 risk-to-reward framework does not guarantee that the intended outcome will be achieved.
The key lesson is that a higher-timeframe zone identifies where a market reaction may matter, while lower-timeframe structure helps evaluate whether that reaction is developing into a potential directional move.
Continue Learning with TradeTogether
Understanding a market analysis becomes more useful when traders also understand the concepts behind it. If you want to build your Forex knowledge progressively, from beginner fundamentals to more advanced technical analysis, explore the TradeTogether Articles Library.
The library brings together educational articles on Forex fundamentals, candlestick patterns, market trends, support and resistance, technical indicators, price action and risk management. You can use these resources as a self-paced learning path to strengthen your understanding of the concepts used in market analysis.
Explore more analysis from this trading session:
View all london Session Analysis →Explore more forex forecasts and market outlooks:
View Forex Forecast Hub →Forex forecast for this session:
View USDJPY london Session Forecast →
Written by
Trade Together Research
Trade Together Research is a professional market analysis team providing forex, gold, and crypto trading insights, technical analysis, and educational guides.. Learn more about our research team on the About page.