XAUUSD Gold Price Analysis (March 16–20, 2026): Daily and 4H Market Structure Highlights Key Reaction Zone
Mon Mar 16 2026
More analysis for this pair:
View all XAUUSD market analysis →Forex forecast for this pair:
View XAUUSD forecast →Market Context
As the new trading week begins (March 16–20, 2026), gold (XAUUSD) is approaching a technically important structural area on the chart. After a corrective movement from the recent swing high, price is currently revisiting a region where multiple technical factors align.
On the Daily timeframe, the market is approaching a previously formed order block and imbalance area, while the 4-hour structure highlights a demand region that previously triggered upward momentum.
Because these zones represent areas where the market previously moved aggressively, many market participants monitor them to understand whether price may react again or continue the correction.
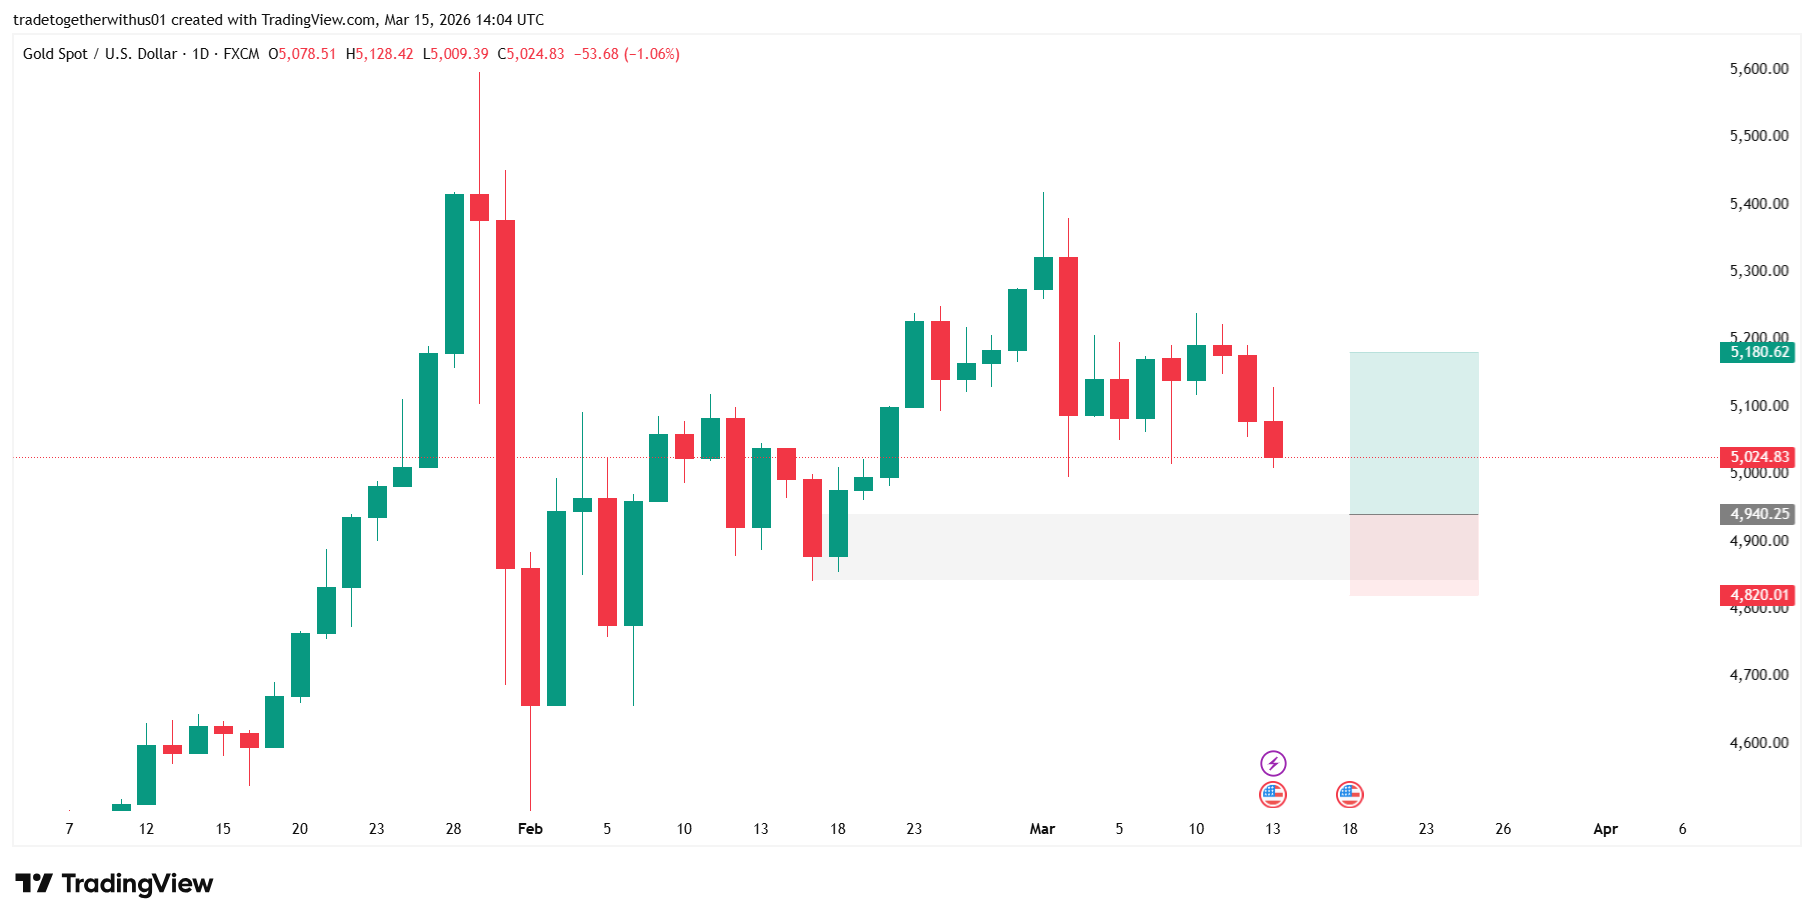
Higher Timeframe Structure: Daily Chart Analysis
On the Daily chart, gold previously produced a strong impulsive movement before entering a corrective phase. During that move, the market left behind a structural zone that can be interpreted as a bullish order block combined with a Fair Value Gap (FVG).
Such areas are often revisited by price as the market attempts to rebalance liquidity.
The current pullback is now approaching that region, making it a technically significant area for the week ahead.
Key structural reference levels visible on the chart include:
Primary Structural Zone: 4,940.25 Structural Invalidation Level: 4,820.01 Upper Structural Liquidity Area: 5,180.62
These levels illustrate the boundaries of the structural zone highlighted on the chart, rather than directional instructions.
4H Market Structure Analysis
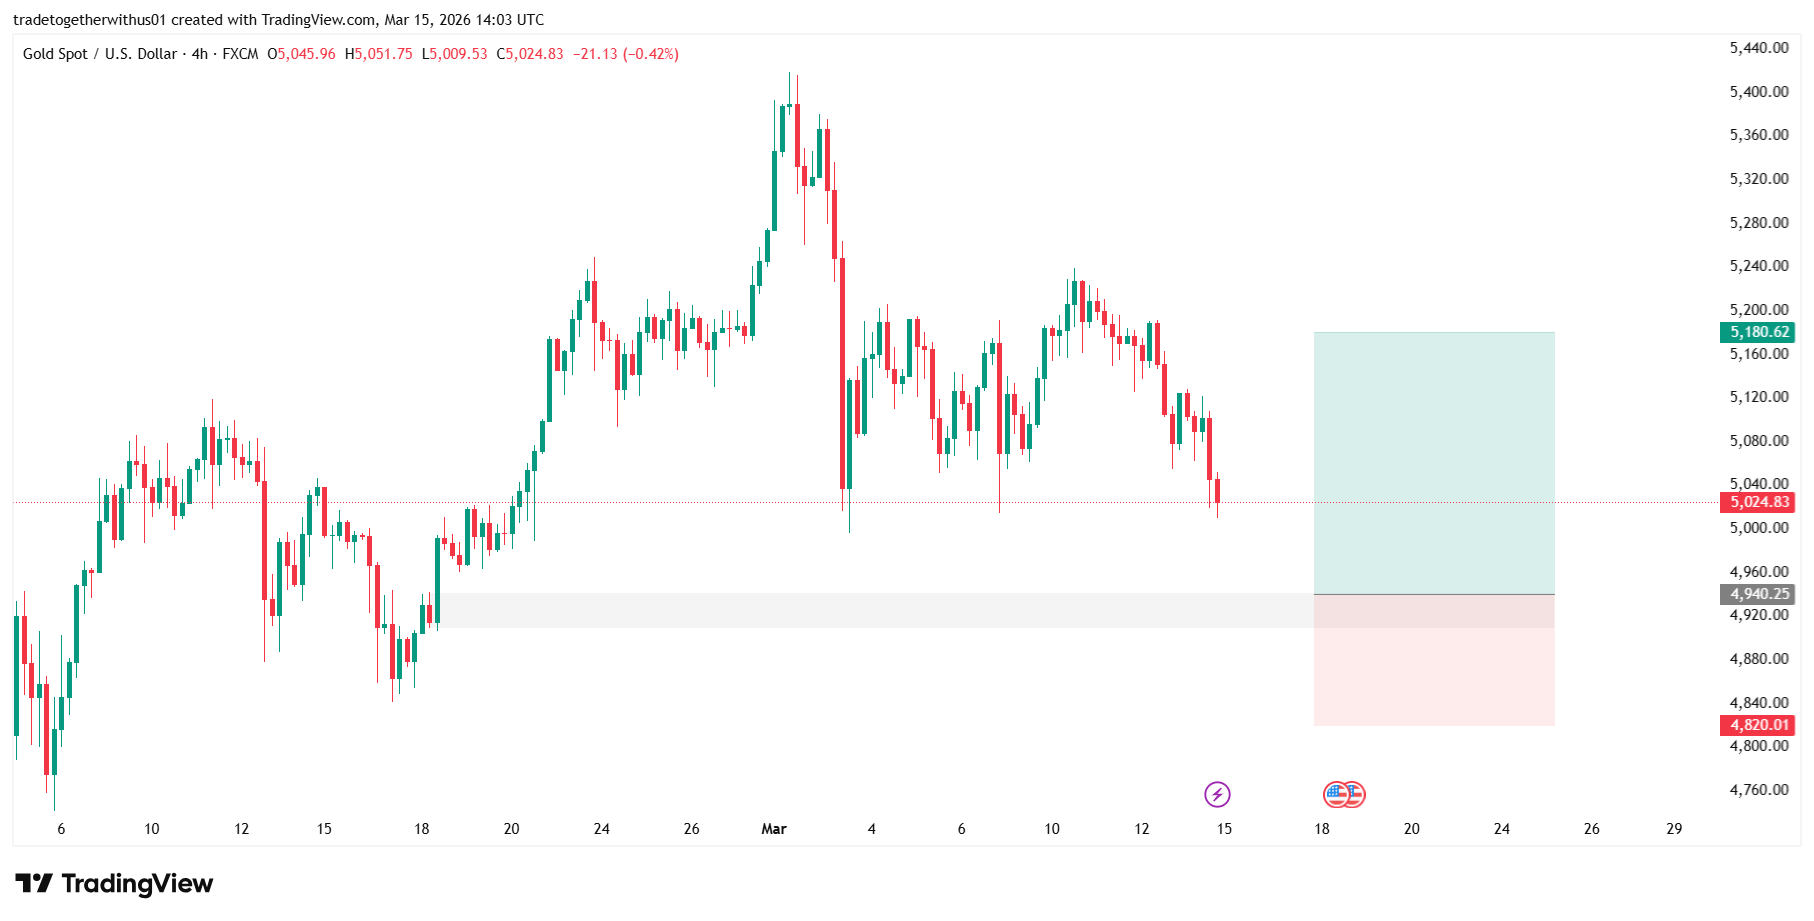
Zooming into the 4-hour timeframe, the internal market structure provides additional context.
Inside the highlighted region, a demand candle can be observed. This candle represents a location where strong buying interest previously entered the market, leading to a rapid upward movement.
Another notable factor is the liquidity positioned above the demand area. Liquidity often accumulates around previous highs or clustered stop levels, and the market sometimes moves toward these areas before establishing its next directional phase.
This creates a situation where price may first interact with nearby liquidity before determining whether the demand region remains active.
Educational Breakdown of the Marked Structural Zones
The highlighted zones on the chart illustrate three distinct technical areas.
Demand Reaction Area
The region around 4,940.25 represents the primary structural area highlighted on the chart. This zone previously acted as a demand region where price reacted strongly.
When the market revisits such areas, analysts typically observe whether the previous reaction was temporary or if the zone continues to influence price behavior.
Structural Risk Reference
The level near 4,820.01 represents the deeper boundary of the structural zone. If price establishes sustained movement below this level, it may indicate that the previously identified demand area is weakening.
Upper Liquidity and Structural Target
The region around 5,180.62 represents the next visible structural area and liquidity cluster on the chart.
If the market reacts positively within the demand region, this level may become an area where price could encounter renewed supply or profit-taking.
Possible Market Scenarios for the Week Ahead
Financial markets can evolve in multiple directions. Several outcomes remain possible.
Scenario 1: Structural Reaction and Upward Rotation
If the demand zone around 4,940.25 continues to attract participation, the market could rotate upward toward the next visible liquidity region near 5,180.62.
Scenario 2: Liquidity Sweep Before Stabilization
In some cases, markets briefly move below demand areas to capture liquidity before reversing. Such moves are common around institutional zones where stop orders accumulate.
Scenario 3: Extended Correction
If price establishes sustained acceptance below 4,820.01, the demand zone may lose its structural significance, potentially leading to further consolidation or extended correction.
What Market Participants May Watch This Week
During the March 16–20, 2026 trading week, several technical elements could shape gold's price action:
- Market behavior inside the 4,940.25 structural demand region
- Whether liquidity above recent highs becomes a target
- Momentum signals on lower timeframes within the 4H structure
- Confirmation of whether the Daily order block and FVG remain active
Observing how price reacts inside these zones often provides valuable insight into the underlying balance between buyers and sellers.
Learning Takeaway
This setup highlights an important principle in market structure analysis.
Markets frequently revisit areas of imbalance, demand zones, and liquidity clusters before deciding their next directional phase. Understanding how these zones interact with price can help traders interpret market behavior more effectively.
Rather than focusing solely on direction, studying how price reacts inside structural zones often provides deeper insight into market dynamics.
Explore more analysis from this trading session:
View all newyork Session Analysis →Explore more forex forecasts and market outlooks:
View Forex Forecast Hub →Forex forecast for this session:
View XAUUSD newyork Session Forecast →
Written by
Trade Together Research
Trade Together Research is a professional market analysis team providing forex, gold, and crypto trading insights, technical analysis, and educational guides.. Learn more about our research team on the About page.