XAUUSD Gold Weekly Technical Analysis: Gold Market Structure Outlook for March 23–27, 2026
Mon Mar 23 2026
More analysis for this pair:
View all XAUUSD market analysis →Forex forecast for this pair:
View XAUUSD forecast →The XAUUSD continues to show strong bullish structure on the higher timeframe, making this week’s XAUUSD weekly analysis for March 23–27, 2026 particularly interesting from a technical perspective.
Recent price action on the weekly chart shows a strong upward impulse followed by a corrective phase. Such pullbacks are typical in trending markets as price revisits structural zones where liquidity and order flow previously existed.
This gold weekly technical analysis focuses on the interaction between market structure, Fibonacci retracement levels, demand zones, and a fair value gap left during the prior bullish expansion.
Gold Market Structure on the Weekly Timeframe
Looking at the weekly chart of XAUUSD, the broader market structure remains clearly bullish.
Price has been consistently forming:
- Higher highs
- Higher lows
- Strong impulsive expansions after structural breaks
These characteristics define a sustained upward trend in the gold market.
During the recent bullish expansion, price broke previous structural highs and created a strong momentum move upward. After such rapid movements, markets often retrace to rebalance inefficiencies created during the impulsive phase.
The current pullback is bringing price back toward an important structural region on the weekly chart.
XAUUSD Chart Structure and Key Technical Observations
The chart used in this XAUUSD weekly chart analysis highlights a confluence area where several technical factors align.
One key observation is the presence of a small demand candle located within the discount area of the previous bullish impulse.
The discount region is identified using Fibonacci retracement analysis, and in this case the 0.618 Fibonacci level aligns closely with that demand candle. This alignment forms a technically interesting confluence zone within the broader trend.
Another important feature on the chart is the presence of a fair value gap (FVG) that formed after the impulsive bullish move. Fair value gaps represent price imbalances created when markets move aggressively with limited opposing order flow.
During corrective phases, markets often revisit these imbalance zones as part of the natural rebalancing process.
This combination of demand zone + Fibonacci 0.618 retracement + fair value gap creates a technically notable region within the gold weekly structure.
Educational Explanation of the Marked Structural Zones
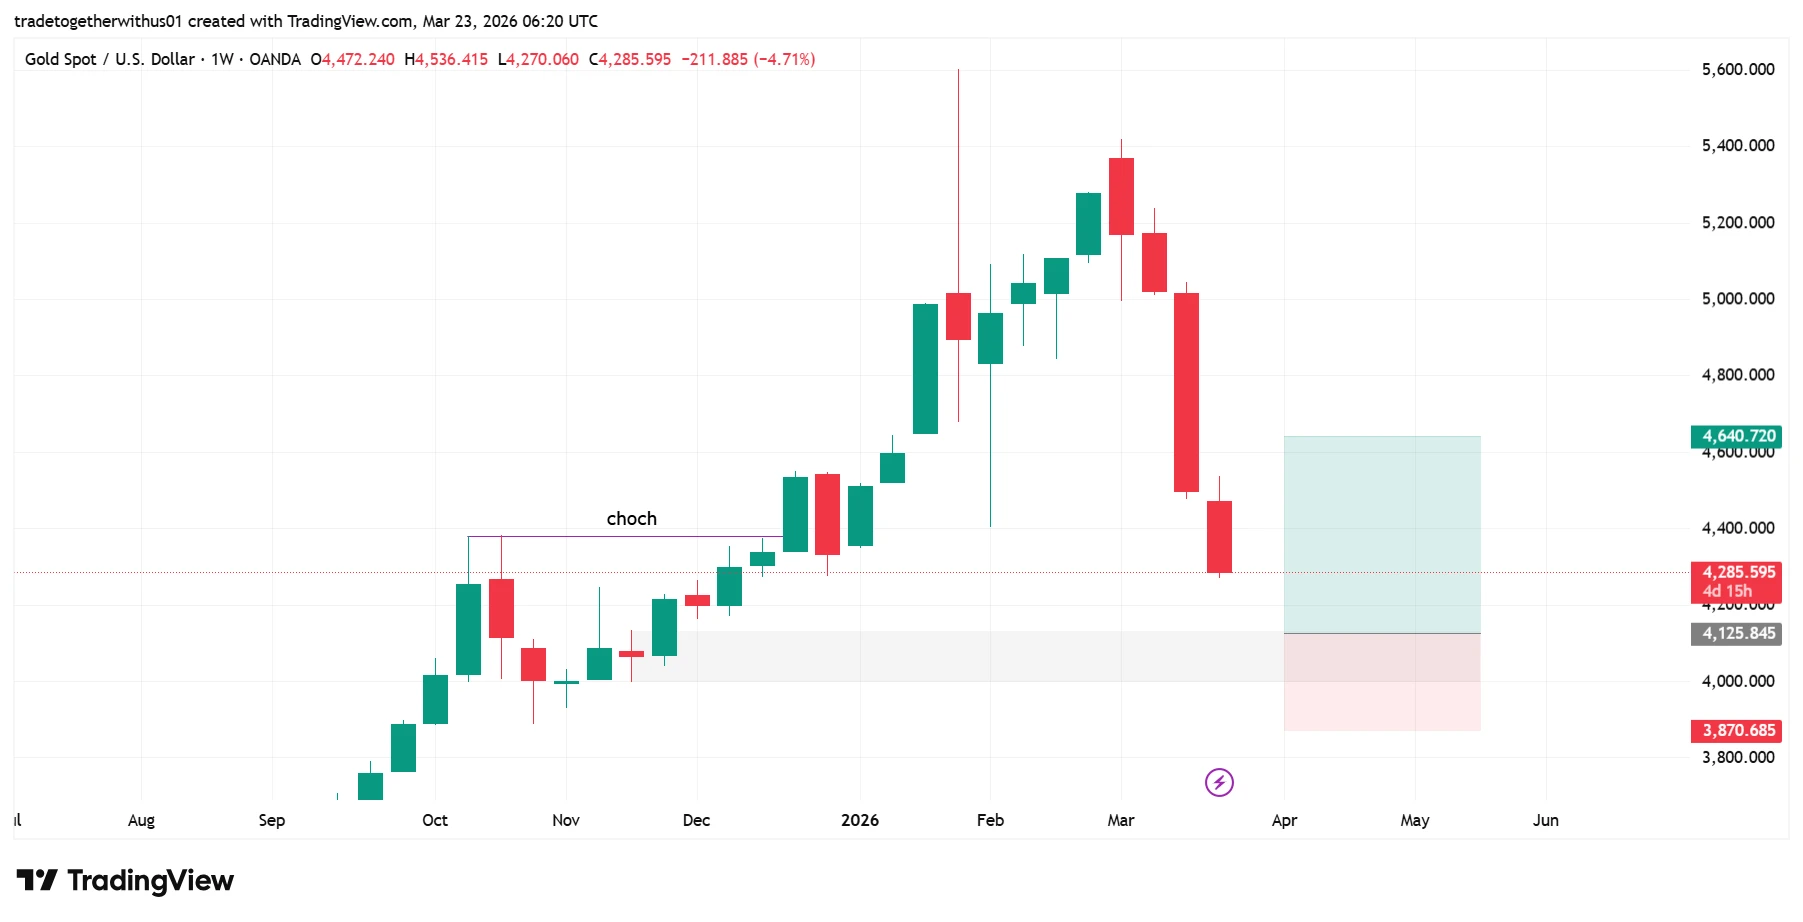
The chart highlights three structural reference levels used for analytical discussion.
Key Structural Levels
- Reference Level: 4,125.845
- Lower Structural Boundary: 3,870.685
- Upper Structural Objective: 4,640.720
These levels represent technical reference zones rather than trading instructions.
The level near 4,125.845 corresponds with the demand candle positioned inside the Fibonacci 0.618 retracement discount area, making it a confluence region within the ongoing trend structure.
The 3,870.685 level represents a deeper structural boundary that may become relevant if the corrective movement extends further.
Meanwhile, the 4,640.720 level represents a projected structural expansion based on the previous bullish impulse on the weekly timeframe.
From an educational perspective, these zones help illustrate how analysts study market structure and price reactions around key technical areas.
Alternative Market Scenarios
Because markets are dynamic, several structural outcomes may develop from this region.
Trend Continuation Scenario
If price stabilizes within the highlighted gold demand zone near the Fibonacci 0.618 retracement, the broader bullish weekly structure may remain intact.
In trending markets, pullbacks into discount areas sometimes precede another impulsive phase in the direction of the dominant trend.
Structural Invalidation Scenario
If price moves decisively below the lower structural boundary near 3,870.685, the market structure may require reassessment.
Such movement could indicate that the corrective phase is evolving into a deeper retracement within the broader gold market trend.
Consolidation Scenario
Another possibility involves extended consolidation within the structural zone.
After strong bullish expansions, markets frequently move sideways while liquidity accumulates before the next directional move develops.
In such situations, price may fluctuate between nearby technical levels for some time.
What Market Participants May Watch Next
Several technical factors may provide clues about the next phase of market development in this gold weekly trend structure analysis:
- Price reaction inside the demand candle zone
- Interaction with the Fibonacci 0.618 retracement level
- Whether the fair value gap begins to rebalance
- Maintenance of the weekly higher-low structure
Monitoring these elements helps traders understand how price behaves around technically significant zones.
Learning Takeaway: Understanding Confluence in Market Analysis
This chart demonstrates an important concept in market structure analysis: technical confluence.
When multiple analytical elements align — such as:
- Fibonacci retracement levels
- Demand zones
- Fair value gaps
- Higher timeframe trend structure
the resulting area becomes a zone worth studying carefully. Even if future price movements vary, learning to identify such confluences helps traders analyze markets more systematically.
Explore more analysis from this trading session:
View all newyork Session Analysis →Explore more forex forecasts and market outlooks:
View Forex Forecast Hub →Forex forecast for this session:
View XAUUSD newyork Session Forecast →
Written by
Trade Together Research
Trade Together Research is a professional market analysis team providing forex, gold, and crypto trading insights, technical analysis, and educational guides.. Learn more about our research team on the About page.