BTCUSD Bitcoin Analysis Today – September 4, 2026
Fri Sep 04 2026
More analysis for this pair:
View all BTCUSD market analysis →Forex forecast for this pair:
View BTCUSD forecast →- Date: September 4, 2026
- Instrument: Bitcoin / U.S. Dollar (BTCUSD)
- Higher Timeframe: 1-Hour
- Execution Timeframe: 5-Minute
- Analysis Type: Intraday Bitcoin Technical Analysis
Market Context
Bitcoin is trading around the $80,700 area after a strong recovery from the lower levels seen during the recent correction.
The recovery has pushed BTCUSD back toward an important 1-hour resistance region where previous price action showed significant selling pressure.
The broader market backdrop is also important. Bitcoin recently moved back above $80,000 as expectations of an immediate Federal Reserve rate hike eased following comments from Fed Governor Christopher Waller. Reuters reported that Bitcoin's recent rally was supported by this shift in rate expectations, while technical analysts noted that the area around the recent highs remains an important test for the market.
This creates an interesting situation: the broader Bitcoin recovery is strong, but price is approaching an area where sellers previously demonstrated significant control.
Bias and Market Structure
1-Hour Bitcoin Structure
The first part of this analysis comes from the 1-hour chart.
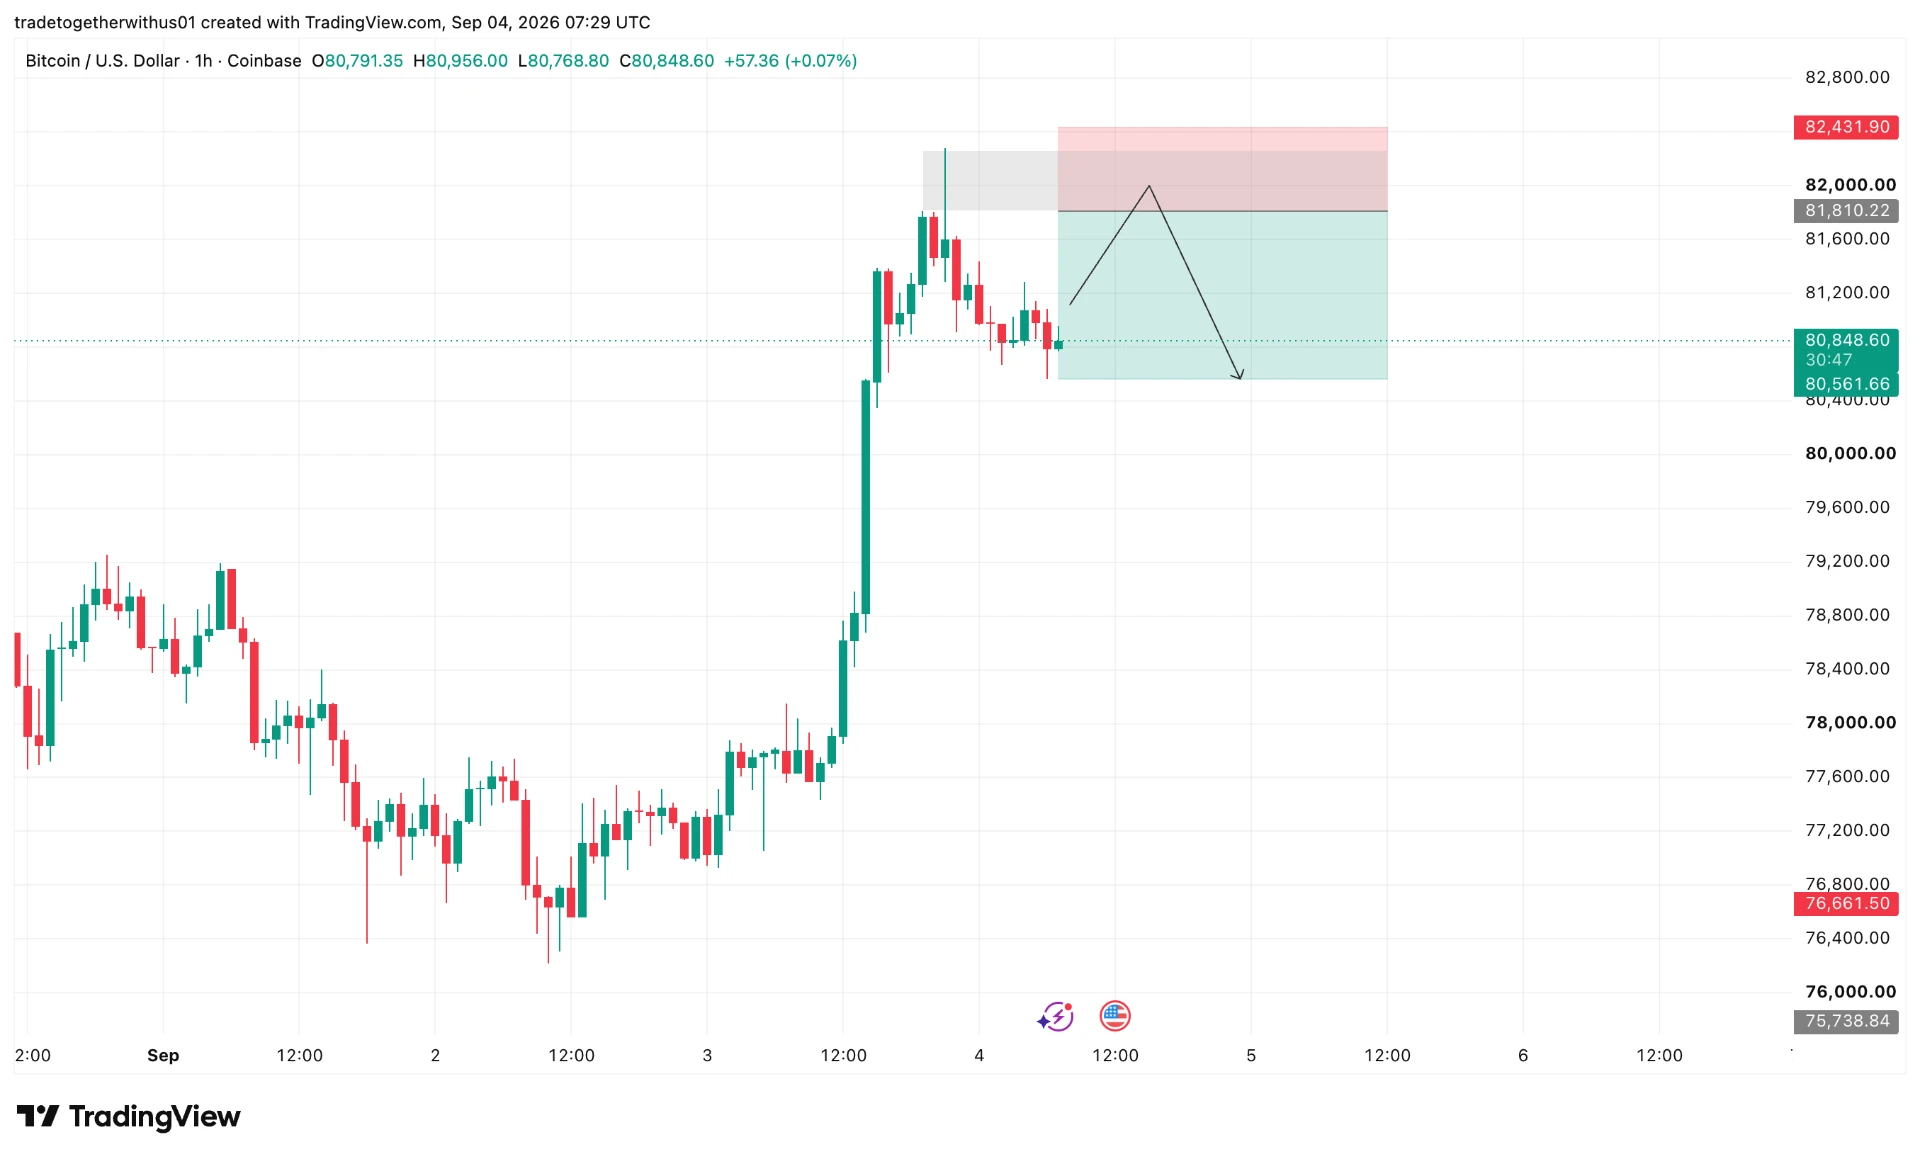
A significant Order Block (OB) was formed before a strong downside movement. The selling pressure from that area created a clear bearish displacement, making the region important for future price reactions.
We marked the main resistance associated with this Order Block using the 81,980.65 area.
Above this region, we also measured approximately 0.75 of the 1-hour ATR to define the broader reaction zone.
When Bitcoin eventually returned toward this area, the ATR-based boundary was respected and price began showing rejection.
This is important because we are not relying on a single horizontal level alone.
The setup combines:
Previous Order Block → strong bearish displacement → resistance → ATR-based reaction zone → rejection
That combination gives the higher-timeframe structure its significance.
5-Minute Market Structure
After the higher-timeframe rejection developed, we moved to the 5-minute chart to study the lower-timeframe structure.
The first important development was a Change of Character (CHOCH) toward the downside.
Following that shift, additional Break of Structure (BOS) movements appeared, reinforcing the bearish short-term structure.
The sequence can therefore be simplified as:
This is the confirmation component of the model.
Rather than attempting to anticipate the lower-timeframe reversal before it develops, the analysis waits for the market structure to demonstrate that selling pressure is actually appearing.
BTCUSD Setup Logic
The planned execution model is positioned above the internal liquidity area following the confirmed bearish structure.
The key technical reference points from the chart are:
- Planned execution level: 81,810.22
- Risk / invalidation boundary: 82,431.91
- Internal liquidity reference: 80,812.67
- Projected objective: 80,561.66
The framework is based on approximately 1:2 risk-to-potential-return, measured from the planned execution level to the structural invalidation boundary and projected objective.
The idea is not simply that Bitcoin is "at resistance."
The setup requires the combination of higher-timeframe resistance and lower-timeframe bearish structure.
Why the Internal Liquidity Matters
The 80,812.67 region is an important part of the setup because it represents an internal liquidity reference within the recent 5-minute structure.
The projected objective is positioned beyond this liquidity area.
This gives the setup a logical structural framework rather than selecting an arbitrary price as the objective.
From a price-action perspective, liquidity can act as an important reference because markets frequently interact with previous swing points and areas where orders may have accumulated.
However, liquidity concepts should be treated as analytical tools rather than guaranteed explanations for future price movement.
Risk and Invalidation
The key invalidation boundary for this setup is 82,431.91.
A sustained move above this region would weaken the bearish thesis because price would be moving beyond the defined reaction zone and invalidating the structure used for this analysis.
The distance to this boundary is based on the volatility framework used in the setup rather than an arbitrary fixed number.
The 80,561.66 area represents the projected objective for this particular technical scenario.
These levels are analytical reference points, not guarantees or instructions to trade.
Bitcoin can move rapidly around macroeconomic events, Federal Reserve expectations, U.S. economic data and changes in broader risk sentiment. Position sizing and risk management therefore remain important when analysing BTCUSD.
What Could Change the Scenario?
The most important thing to monitor is how Bitcoin behaves around the 81,810–82,432 region.
The bearish scenario would become weaker if:
- BTCUSD breaks decisively above the broader resistance area.
- Price begins accepting above the previous Order Block.
- The 5-minute bearish structure fails.
- New bullish BOS formations develop.
- Momentum continues higher without meaningful rejection.
On the other hand, continued rejection combined with lower-timeframe bearish structure would keep the original scenario technically relevant.
This is why the analysis is based on reaction and structure, rather than assuming that a resistance level must produce a reversal.
Bitcoin Market Outlook
Bitcoin's current position is particularly interesting because the broader market has recently regained bullish momentum.
The latest rally above $80,000 has occurred alongside easing expectations for an immediate Fed rate hike, while markets remain focused on upcoming U.S. economic data.
That macro backdrop means the technical resistance being studied here should not be viewed in isolation.
If the market continues receiving supportive macro signals, Bitcoin could challenge higher resistance.
If sentiment reverses or the resistance structure attracts renewed selling pressure, the lower-timeframe bearish setup becomes more relevant.
The market reaction will determine which scenario develops.
How We Analyse BTCUSD at TradeTogether
At TradeTogether, our approach is to connect higher-timeframe structure with lower-timeframe price action rather than relying on one indicator or one prediction.
For this BTCUSD analysis, the process was:
1H Order Block → 1H ATR reaction zone → rejection → 5M CHOCH → 5M BOS → execution model
This framework allows the analysis to remain structured while still adapting to what price is actually doing.
For more Forex, Gold and market-structure analysis, follow TradeTogether on Instagram.
You can also continue learning through the Forex Foundation Masterclass and Trader Psychology Series.
Explore more analysis from this trading session:
View all london Session Analysis →Explore more forex forecasts and market outlooks:
View Forex Forecast Hub →Forex forecast for this session:
View BTCUSD london Session Forecast →
Written by
Trade Together Research
Trade Together Research is a professional market analysis team providing forex, gold, and crypto trading insights, technical analysis, and educational guides.. Learn more about our research team on the About page.