XAUUSD Gold Analysis Today – September 3, 2026
Thu Sep 03 2026
More analysis for this pair:
View all XAUUSD market analysis →Forex forecast for this pair:
View XAUUSD forecast →- Date: September 3, 2026
- Instrument: Gold (XAUUSD)
- Higher Timeframe: 1-Hour
- Analysis Timeframe: 1-Hour
- Analysis Type: Intraday Gold Technical Analysis
Gold Market Context
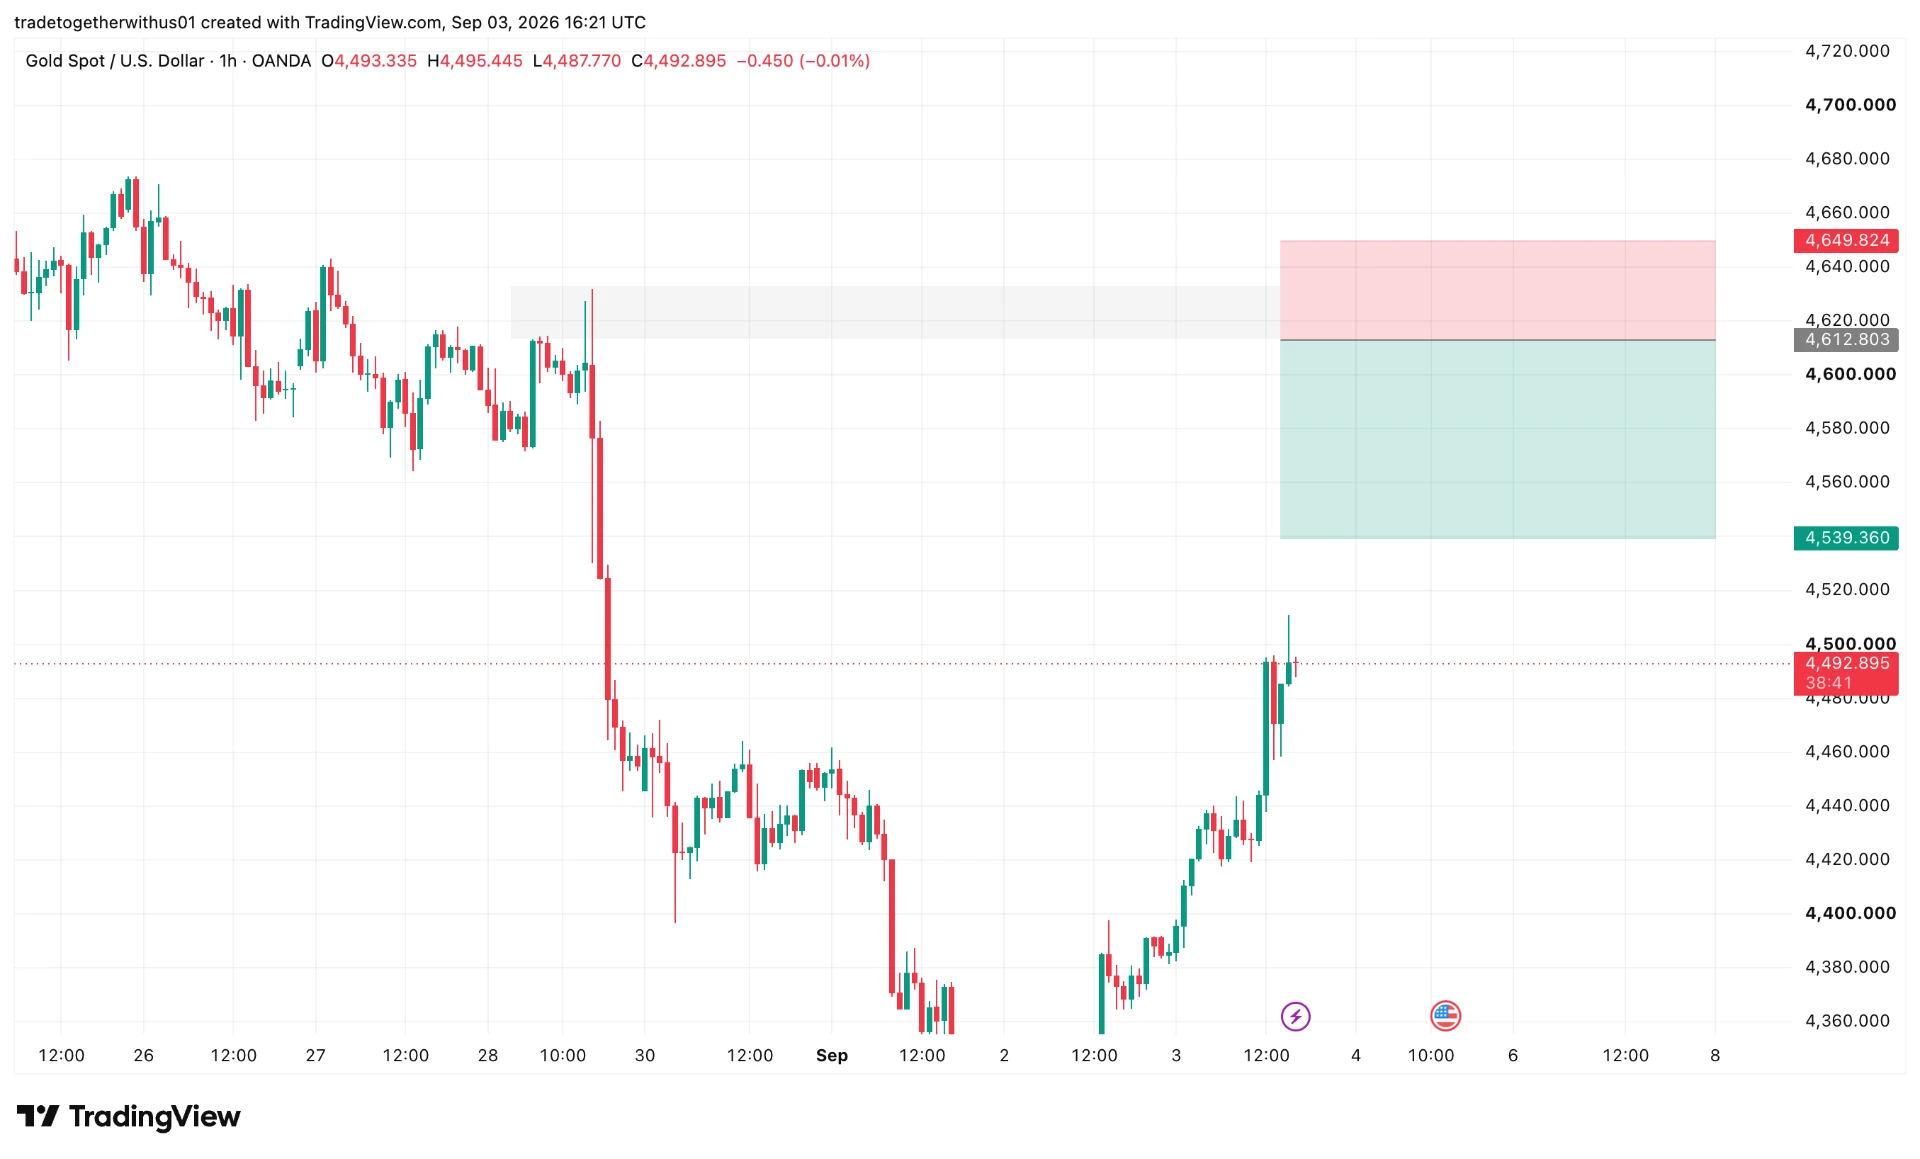
Gold has made a strong recovery from the recent decline, with price currently trading around the 4,490 area after moving higher from the recent lows.
The recovery has brought XAUUSD back toward an important higher-timeframe resistance region around 4,612–4,650.
This zone is significant because the previous interaction with this area produced a powerful bearish displacement, leaving behind a large Fair Value Gap (FVG) and an important order-block structure.
At the same time, the recent bullish recovery means we should not assume that the previous reaction will automatically repeat. The way price behaves when it reaches the zone will be important.
Why Gold Moved Higher Today
The recent upside movement also comes against a changing U.S. monetary-policy backdrop.
Federal Reserve Governor Christopher Waller said on September 3 that he would be willing to support keeping interest rates at their current level at the September meeting if incoming inflation data continues to show progress toward the Fed's 2% objective. However, he also left the possibility of a rate hike open if inflation comes in hotter than expected.
Markets subsequently reduced some of their expectations for a September rate hike. The probability of a hike moved down to around 48% from 63% the previous day, according to CME FedWatch data reported by Barron's.
This type of shift in Federal Reserve expectations, U.S. yields and the dollar can have an important influence on gold.
However, the fundamental news should be viewed as context rather than as a reason to assume a particular price direction. The upcoming inflation data remains important because Waller explicitly indicated that his September decision will depend heavily on the incoming data.
Higher-Timeframe Gold Structure
Looking at the 1-hour chart, the 4,612.167 region has previously acted as an important resistance area.
Above it sits another major reference around 4,649.890.
During the previous decline, price produced strong selling pressure from this region. The move was large enough to create a significant imbalance/FVG, while the surrounding price action also formed an order-block area.
Another important observation is that liquidity above the previous resistance had already been swept before the major bearish displacement occurred.
Therefore, the area around 4,612–4,650 is not simply a random resistance level. It combines several pieces of previous market structure:
Previous resistance → liquidity sweep → strong bearish displacement → FVG → order-block area
That historical reaction is the main reason we are watching this region again.
Current Gold Setup
With price recovering strongly from the recent lows, our focus is now on how XAUUSD behaves when it approaches the previous supply region.
For this analysis, we are considering a direct-entry approach around the lower boundary of the marked resistance area rather than waiting for a lower-timeframe confirmation.
The main technical reference points are:
- Primary reference area: 4,611.755
- Upper structural boundary: 4,649.890
- Projected downside objective: 4,535.611
- Risk framework: approximately 0.75 of the 1-hour ATR range
The broader idea is based on the expectation that the previously important resistance region could once again produce a reaction.
However, this is a predefined technical scenario, not a claim that price must reverse from the area.
Direct Entry vs Confirmation
This analysis uses a direct approach because the higher-timeframe area itself has enough historical significance to justify monitoring the reaction without requiring an additional confirmation pattern.
That does not mean confirmation is unnecessary for every trader.
A trader who prefers additional confirmation can wait for price to reach the region and then study lower-timeframe behaviour, such as:
- A change in market structure
- Rejection from the resistance area
- Bearish displacement
- Failure to maintain higher prices
- A new lower-timeframe area of interest
The trade-off is simple: direct positioning can provide earlier participation but carries greater uncertainty, while waiting for confirmation may provide more information but can result in a less favourable price or no setup at all.
Invalidation and Risk
The 4,649.890 region is the key structural boundary in this analysis.
A sustained move through this area would weaken the original bearish thesis because price would be moving beyond the historical resistance region that forms the basis of the setup.
The risk framework is based on approximately 0.75 of the 1-hour ATR, allowing the analysis to account for current market volatility rather than using an arbitrary fixed distance.
The projected downside area is around 4,535.611.
These levels are technical reference points from our analysis and are not guaranteed future price levels or instructions to trade.
Gold can experience substantial volatility around Federal Reserve communication, inflation data, employment data, geopolitical developments and changes in U.S. Treasury yields. Proper position sizing and capital preservation remain essential.
What We Are Watching Next
The most important question is not simply whether gold reaches 4,612–4,650.
The important question is how price behaves when it gets there.
We will be watching:
- Whether the previous resistance zone produces another rejection.
- Whether price breaks and accepts above the 4,649.890 region.
- Whether bearish displacement develops from the area.
- Whether the previous FVG/order-block structure remains relevant.
- How U.S. inflation expectations, Treasury yields and the dollar affect gold volatility.
- Whether the current bullish recovery continues to develop into a larger structural change.
This keeps the analysis reactive rather than treating the market as something that can be predicted with certainty.
How We Approach Gold at TradeTogether
At TradeTogether, we do not rely on one fixed market view regardless of what price is doing.
We study the higher-timeframe structure, liquidity, order blocks, FVGs, volatility and lower-timeframe price behaviour, then adapt our analysis as the market evolves.
For regular gold and Forex market updates, follow TradeTogether on Instagram.
If you want to build your Forex knowledge step by step, explore our Forex Foundation Masterclass.
For the psychological side of trading, you can also explore our Trader Psychology Series.
Conclusion
Gold has recovered strongly from its recent lows and is now approaching the 4,612–4,650 higher-timeframe resistance region.
This area previously produced significant selling pressure after a liquidity sweep, creating the FVG and order-block structure that forms the basis of the current analysis.
The current scenario is therefore focused on observing whether that historical reaction develops again.
At the same time, the fundamental environment has changed, with Federal Reserve expectations becoming an important driver of gold volatility. Waller's latest comments make the upcoming inflation data particularly important.
Explore more analysis from this trading session:
View all newyork Session Analysis →Explore more forex forecasts and market outlooks:
View Forex Forecast Hub →Forex forecast for this session:
View XAUUSD newyork Session Forecast →
Written by
Trade Together Research
Trade Together Research is a professional market analysis team providing forex, gold, and crypto trading insights, technical analysis, and educational guides.. Learn more about our research team on the About page.