USDCHF Forecast Today – March 13, 2026: Resistance Rejection and Shooting Star Signal Near 0.7874 on the 1H Chart
Fri Mar 13 2026
More analysis for this pair:
View all USDCHF market analysis →Forex forecast for this pair:
View USDCHF forecast →Market Context
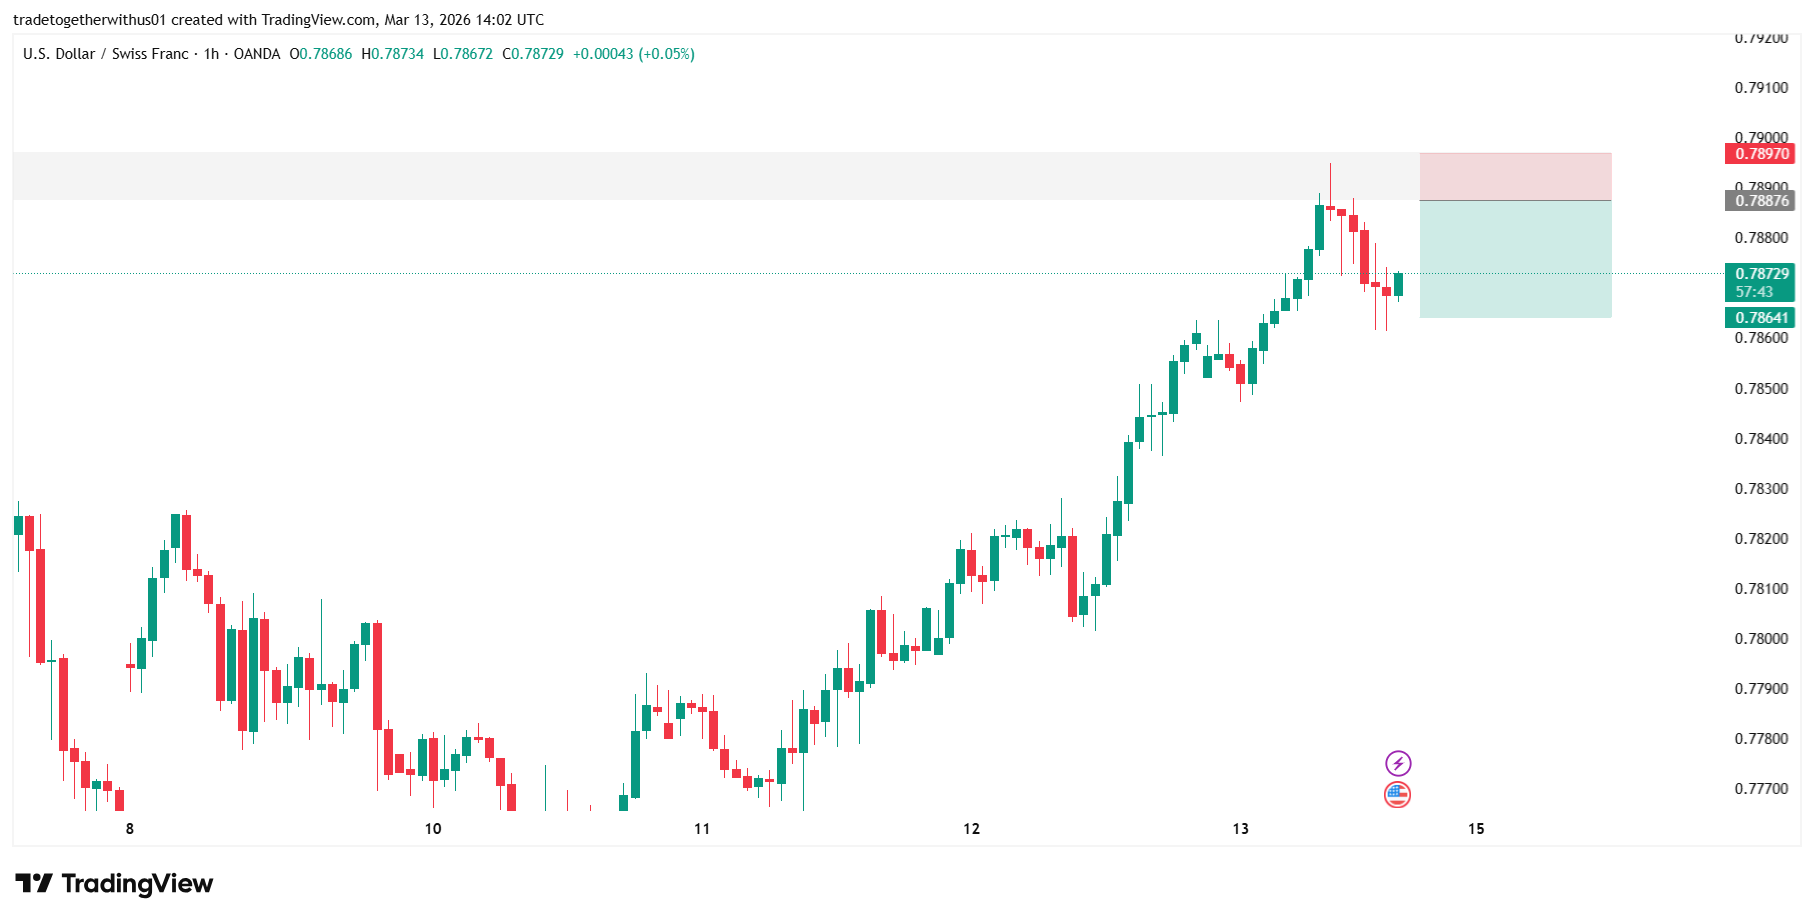
The USDCHF currency pair has recently displayed steady upward momentum, gradually approaching an important technical level around 0.7874. This level has historically acted as a meaningful structural zone on the 1-hour timeframe, attracting multiple price reactions in previous sessions.
As price returned to this region, market behavior suggested that participants were closely monitoring this area for potential structural reactions. The latest interaction with this level produced a visible rejection, providing a useful example of how historical support zones can transform into resistance during market retracements.
This type of price action often highlights the importance of combining higher timeframe context with lower timeframe structure shifts.
Higher Timeframe Structure Analysis (1H)
On the 1-hour chart, USDCHF had been forming a short-term bullish structure characterized by a sequence of higher highs and higher lows. This gradual upward movement pushed price back toward the 0.7874 zone, which had previously acted as support multiple times.
When price revisits a level that previously acted as support, it can frequently behave as resistance once broken, a common principle in technical market structure analysis.
In this case, the 0.7874 region aligns with a previously identified order block and Fair Value Gap (FVG). These types of zones often represent areas where significant institutional activity previously occurred.
As price entered this region, the market produced a noticeable rejection, suggesting that liquidity and opposing orders were present within this structural zone.
Current Chart Structure and Key Observations
As USDCHF approached the 0.7874 resistance area, the market produced a clear reaction from the zone.
Several key observations can be made from the chart:
- Price rallied strongly toward the resistance level.
- The market entered a previously identified 1-hour order block region.
- Within this zone, price formed a rejection candle with a long upper wick.
- The structure of this candle closely resembles a Shooting Star candlestick pattern, which often appears near resistance levels.
A Shooting Star candle typically forms when buyers initially push price higher but encounter strong selling pressure before the close of the candle. The result is a long upper shadow and a small body near the lower portion of the candle range.
For readers who want to understand this candlestick structure in detail, a full explanation is available in our guide: Candlestick Types Explained: Marubozu, Doji, Spinning Top and More https://tradetogether.in/articles/candlestick-types-explained-marubozu-doji-spinning-top
Understanding candlestick formations like the Shooting Star can help traders interpret moments where market momentum begins to shift near key technical zones.
Lower Timeframe Momentum Shift (5-Minute Chart)
After the rejection occurred on the higher timeframe resistance area, the 5-minute chart began showing a noticeable shift in structure.
A Change of Character (ChoCh) appeared on the lower timeframe, signaling a potential transition from bullish momentum to bearish short-term structure.
Earlier in the move, the market had produced a Break of Structure (BoS) that supported the bullish movement. However, once the resistance reaction occurred, the formation of a ChoCh indicated that short-term momentum had started to weaken.
These lower timeframe structure shifts often provide early clues that the market is transitioning into a new phase.
Educational Explanation of the Marked Zones
The chart used in this analysis highlights three key structural regions that help explain how the setup developed.
Entry Reference Zone (Grey Area)
The grey horizontal zone near 0.78740–0.78800 marks the area where price interacted with a previously identified order block and resistance level.
Historically, this level acted as support multiple times, which made it a significant technical reference on the higher timeframe. When price later returned to this region from below, the level behaved as resistance, leading to a reaction from the zone.
Inside this area, the market formed a rejection candle with a long upper wick, resembling a Shooting Star candlestick pattern, indicating that upward momentum faced selling pressure. This reaction from the resistance zone provided the context for the structural move that followed.
Risk Reference Zone (Red Area)
The red box above the grey zone highlights the structural area where the bearish scenario would become invalidated if price were to move above it.
From a market structure perspective, a sustained move above this region could indicate that buyers are regaining control and that the resistance rejection may not hold.
This area therefore represents the upper boundary of the resistance reaction zone.
Downside Reference Zone (Green Area)
The green box below the grey zone represents a lower structural region where price could potentially move if the downside momentum continues.
This area aligns with nearby liquidity zones and prior price interaction levels where the market previously paused or reversed.
Markets often gravitate toward such areas when momentum shifts after a rejection from higher-timeframe resistance.
Alternative Market Scenarios
Financial markets are dynamic, meaning multiple outcomes remain possible from the current structure.
Scenario 1: Continued Downside Development
If the bearish momentum observed after the rejection continues, USDCHF may gradually move toward the lower structural liquidity zones. This scenario would align with the rejection observed near the 0.78740 resistance region.
Scenario 2: Resistance Reclaim
If price manages to move back above the resistance zone and hold above it, the recent rejection could become invalidated. Such behavior may suggest renewed bullish strength and a continuation of the prior upward structure.
Scenario 3: Consolidation Around the Level
Another possibility is sideways consolidation around the resistance zone as the market builds liquidity before a clearer directional move develops. This type of consolidation often occurs near significant structural levels.
What Market Participants Should Watch Next
Going forward, traders and analysts may monitor several factors:
- Whether price continues to respect the 0.78740 resistance zone
- Development of lower timeframe market structure
- Appearance of additional rejection or momentum candles
- Reactions around nearby liquidity zones
These elements often help determine whether the market will continue the current structural shift or revert back to the previous trend.
Learning Takeaway
This chart provides several important technical lessons for traders and analysts:
- Previous support levels can become resistance when revisited.
- Order blocks and Fair Value Gaps often act as reaction zones.
- Candlestick rejection patterns like the Shooting Star can signal momentum shifts.
- Lower timeframe Change of Character (ChoCh) structures can indicate early trend transitions.
By combining market structure analysis, candlestick behavior, and liquidity zones, traders can gain a clearer understanding of how price movements develop.
Explore more analysis from this trading session:
View all newyork Session Analysis →Explore more forex forecasts and market outlooks:
View Forex Forecast Hub →Forex forecast for this session:
View USDCHF newyork Session Forecast →
Written by
Trade Together Research
Trade Together Research is a professional market analysis team providing forex, gold, and crypto trading insights, technical analysis, and educational guides.. Learn more about our research team on the About page.