Types of Candlesticks in Trading: Marubozu, Doji, Spinning Top and More — And Their Applications (Chapter 8 – Part 2)
Thu Mar 12 2026
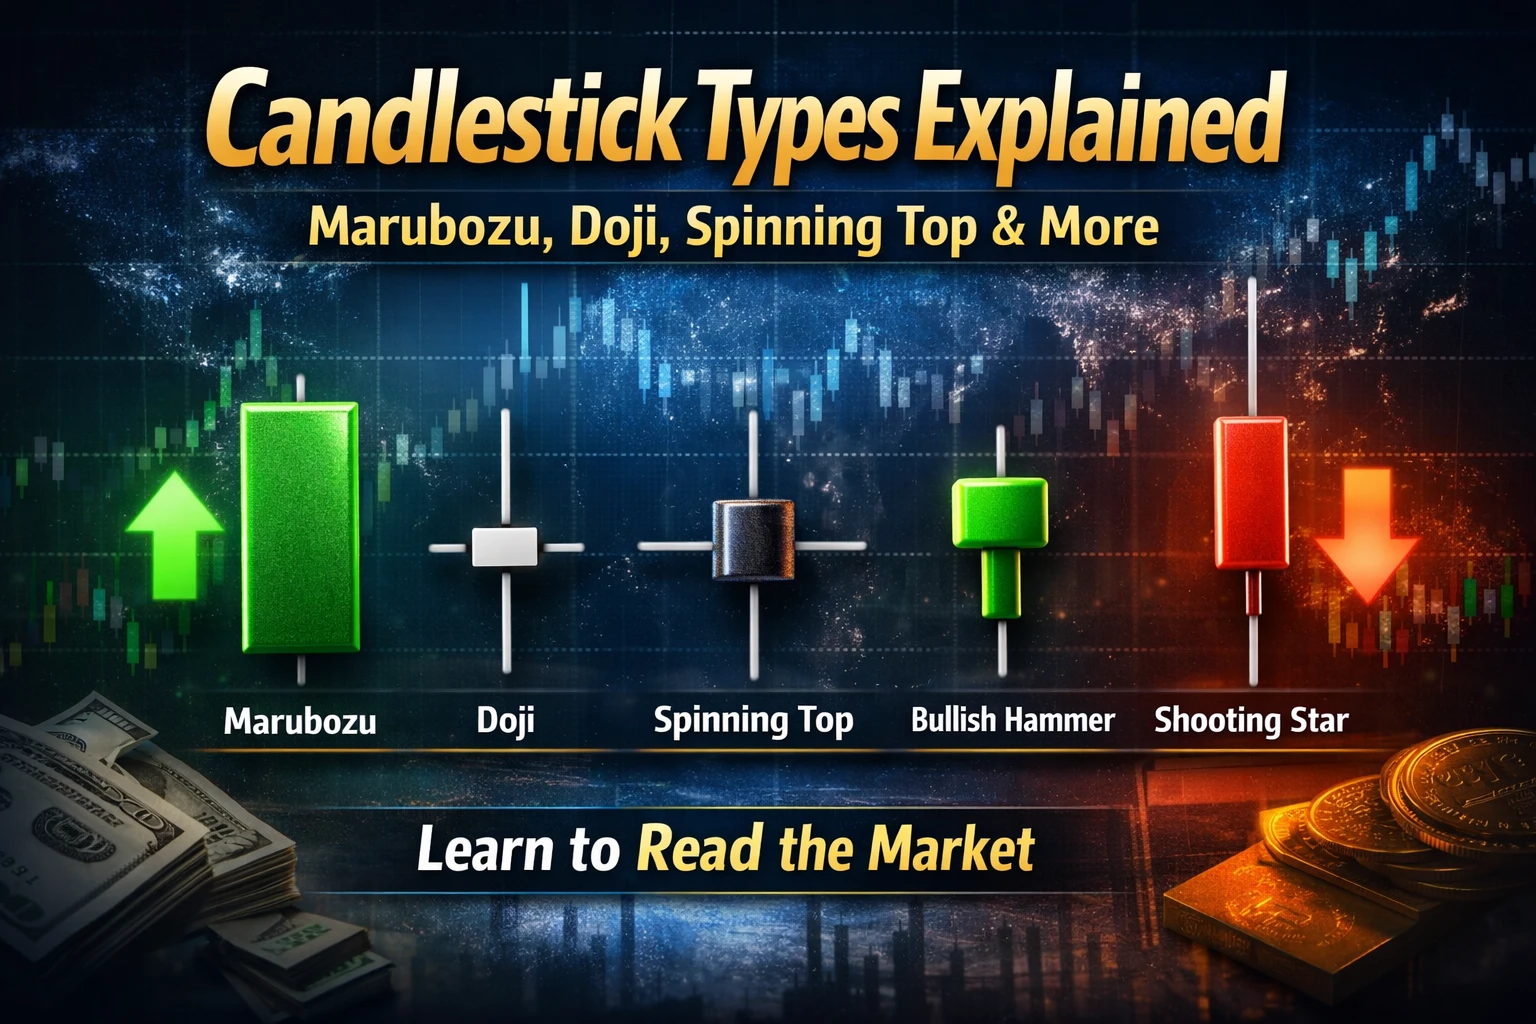
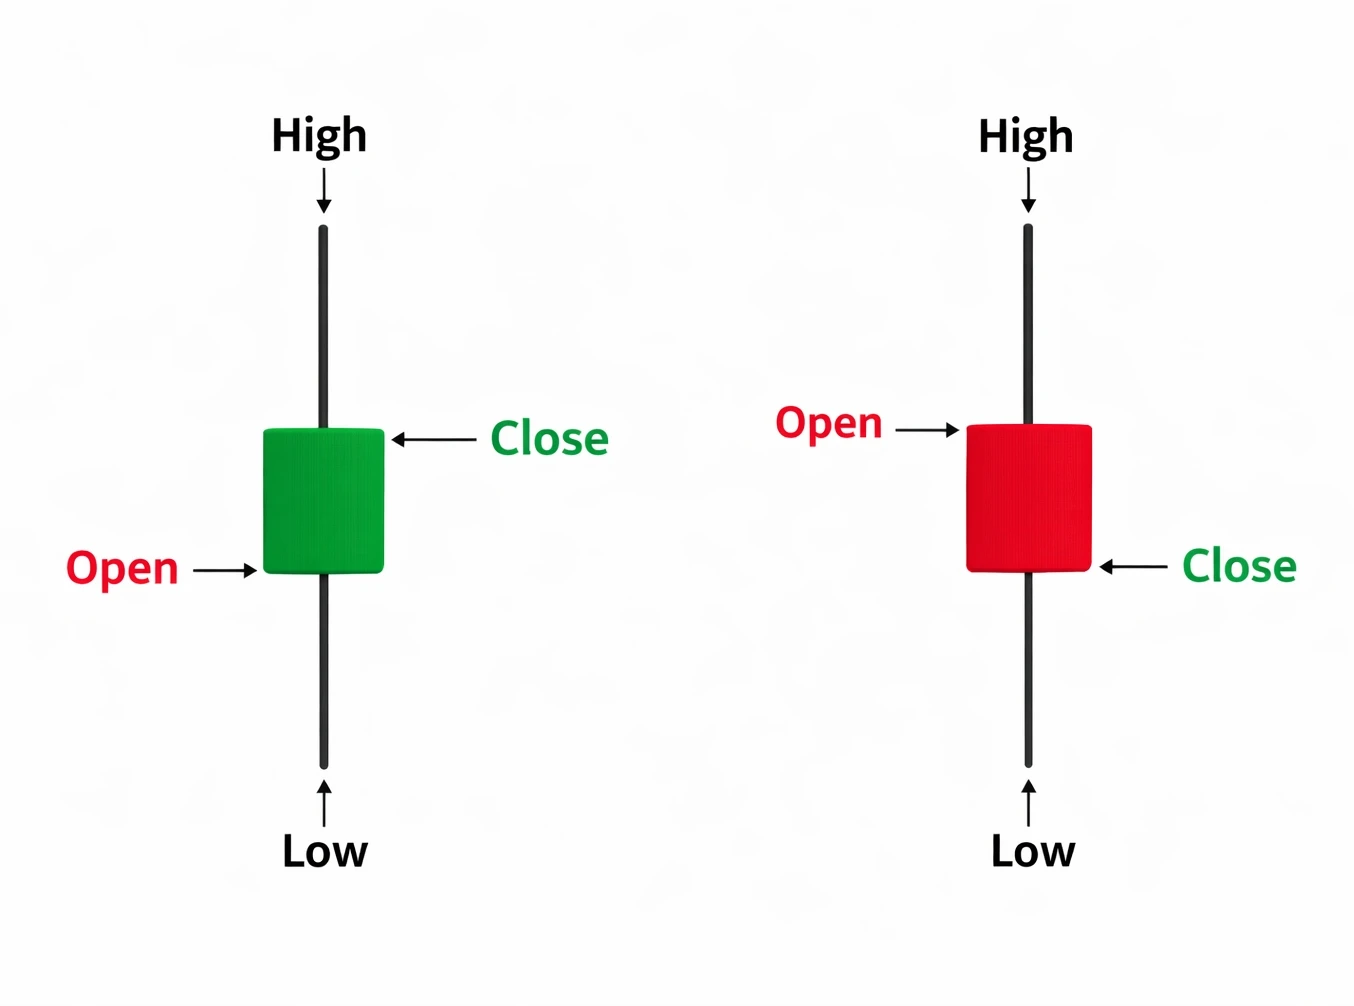
Introduction: Understanding Different Candlestick Types
In Chapter 8 – Part 1 🔗https://tradetogether.in/articles/how-to-read-candlestick-charts-beginners-bullish-bearish , we introduced the basic structure of candlestick charts and learned how each candle represents open, high, low, and close prices during a specific timeframe.
Now we move one step further.
Different candles appear in the market depending on how buyers and sellers interact during a trading session. These candles are called candlestick types, and each one reflects a specific type of market behavior.
Understanding these candles helps traders observe:
- Market momentum
- Buyer and seller pressure
- Possible trend continuation or hesitation
However, it is important to remember that a single candle does not guarantee future price movement. Professional traders usually combine candle analysis with market structure, support and resistance levels, and liquidity conditions.
For example, earlier in Chapter 4 we discussed how the forex market is decentralized and driven by liquidity 🔗https://tradetogether.in/articles/centralized-vs-decentralized-forex-market-structure, which is why price behavior often reflects the interaction between large market participants and retail traders.
In this chapter, we will explore several commonly observed candle types used in price action analysis.
Types of Candles in Trading
In financial markets, candles can form in different shapes depending on how price moved during that period. Some commonly observed candle types include:
- Marubozu
- • Doji
- Spinning Top
- Paper Umbrella
- Shooting Star
Each of these candles reflects a different balance between buyers and sellers.
By observing candle structure, traders can better understand market psychology, which is a key component of technical analysis.
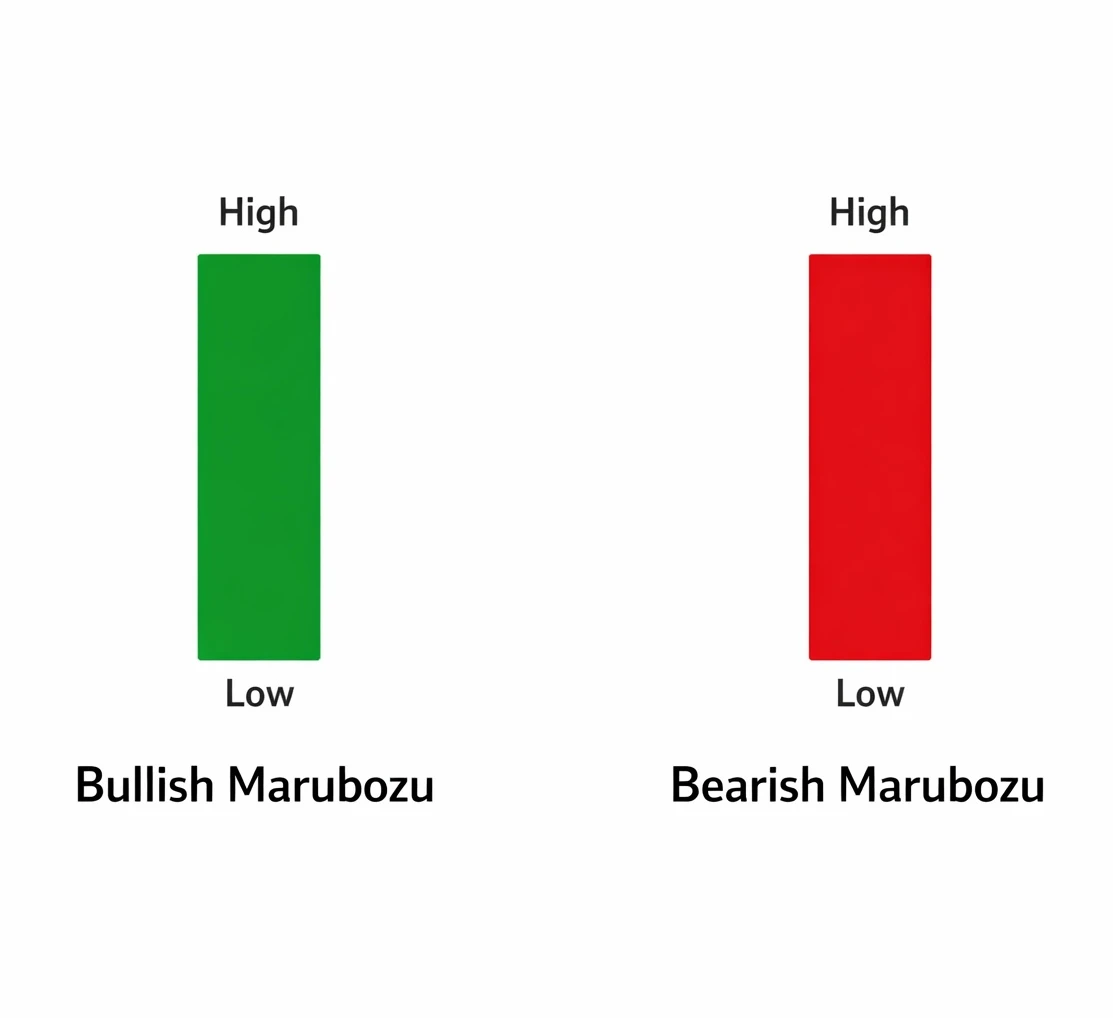
1. Marubozu Candle
A Marubozu candle is a candlestick that has little or no shadows (wicks) on either side of the body.
This means the price moved strongly in one direction during the entire period without much opposition.
What Happens in a Marubozu Candle
When a Marubozu forms:
- The market opens near the lowest or highest point
- Price continues moving strongly in one direction
- The candle closes near the extreme end of the range
This structure suggests strong directional momentum in the market.
Application in Market Analysis
A Marubozu candle may indicate:
- Strong buying pressure in a bullish candle
- Strong selling pressure in a bearish candle
However, experienced traders confirm this observation using:
- Trend direction
- Support and resistance levels
- Market liquidity zones
This is important because volatility and liquidity shifts can sometimes produce strong candles without indicating a long-term trend change.
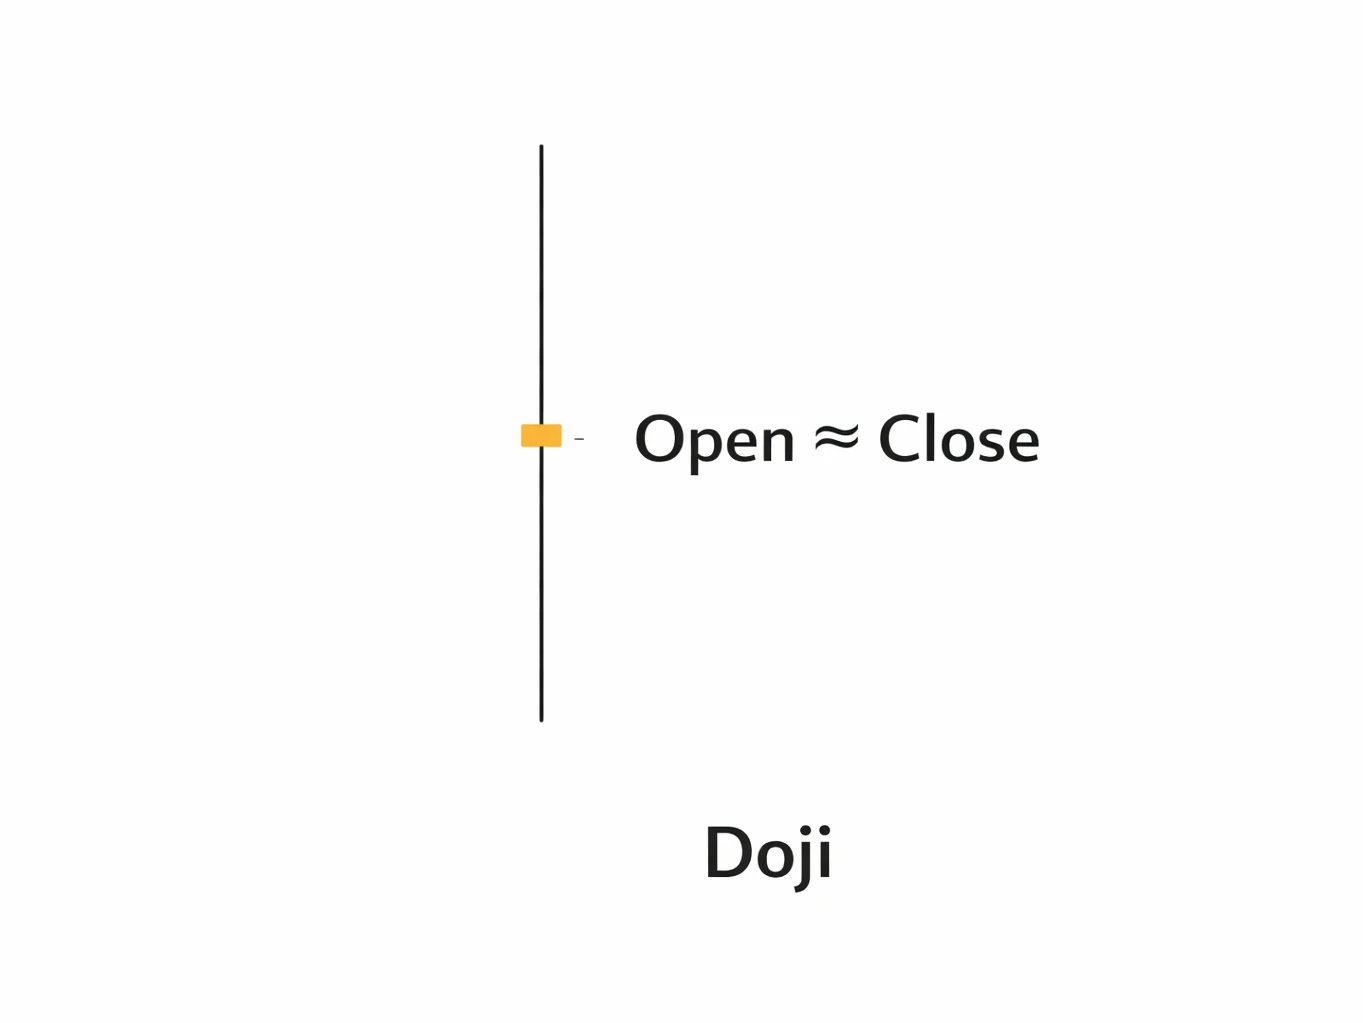
2. Doji Candle
A Doji candle forms when the opening and closing prices are very close to each other.
This creates a candle with a very small body and longer shadows.
What Happens in a Doji Candle
During the time period:
- Buyers push price upward
- Sellers push price downward
- Eventually the candle closes near the opening level
This indicates indecision in the market.
Application in Market Analysis
A Doji candle often suggests:
- A temporary balance between buyers and sellers
- Possible pause in the current trend
- Increased market uncertainty
Doji candles frequently appear near important support or resistance zones, where traders are deciding whether the market will continue moving or reverse.
3. Spinning Top Candle
A Spinning Top candle has:
- A small body
- Upper and lower shadows
- Similar distance between the opening and closing prices
What Happens in a Spinning Top
This candle shows that both buyers and sellers were active, but neither side gained clear control.
The price moves up and down during the period but eventually closes near the middle of the range.
Application in Market Analysis
A spinning top often indicates:
- Market consolidation
- Reduced momentum
- Temporary indecision
Traders sometimes observe spinning tops during trend slowdowns or before major economic announcements, when market participants wait for new information.
4. Paper Umbrella Candle
The Paper Umbrella candle has a long lower shadow and a small body near the top of the candle.
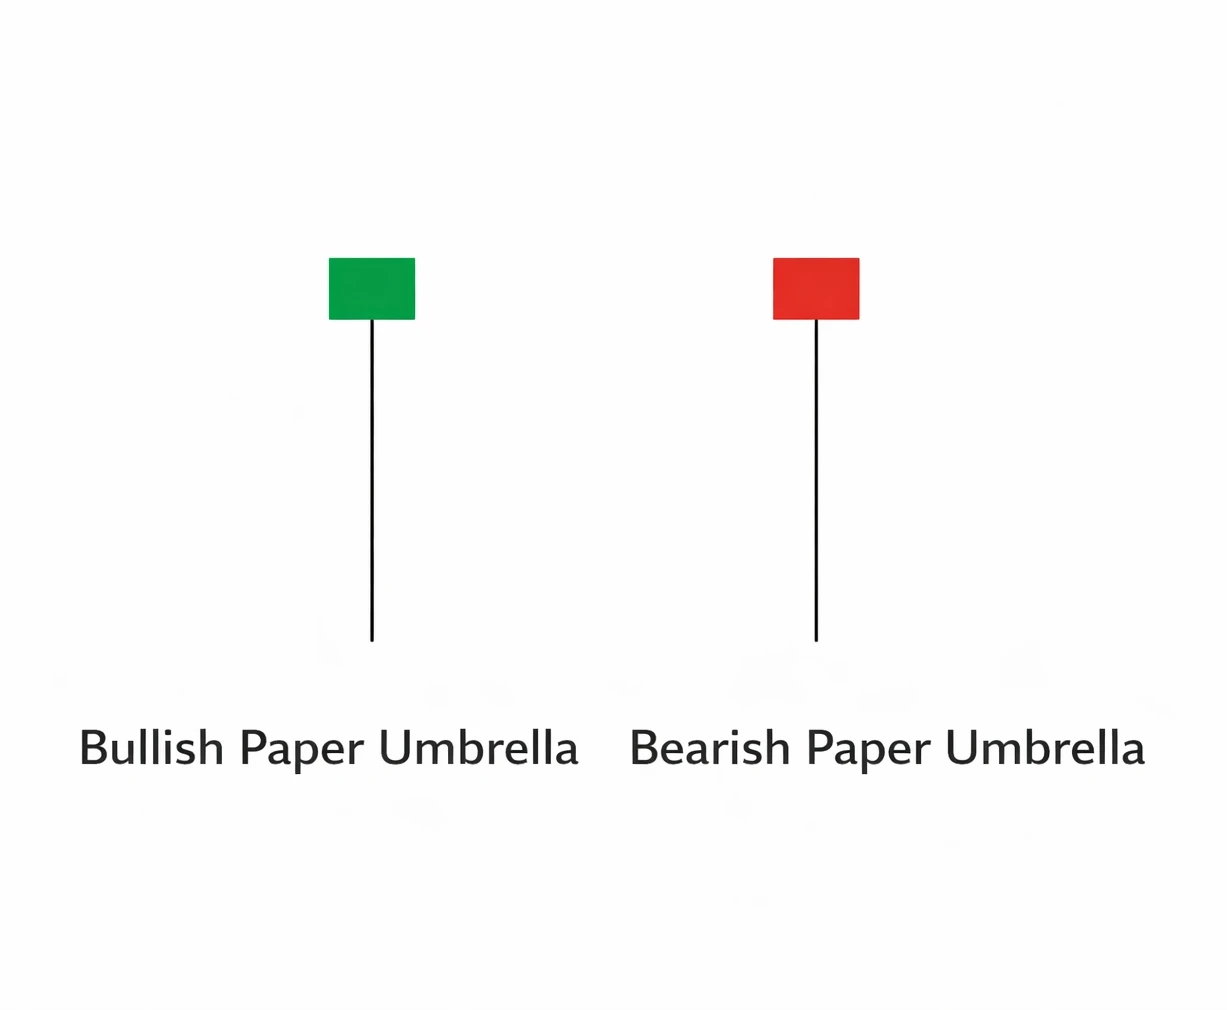
What Happens in This Candle
During the trading period:
- Sellers initially push the price lower
- Buyers later enter and push the price back upward
- The candle closes near the upper portion of the range
This shows that buying pressure appeared after selling pressure.
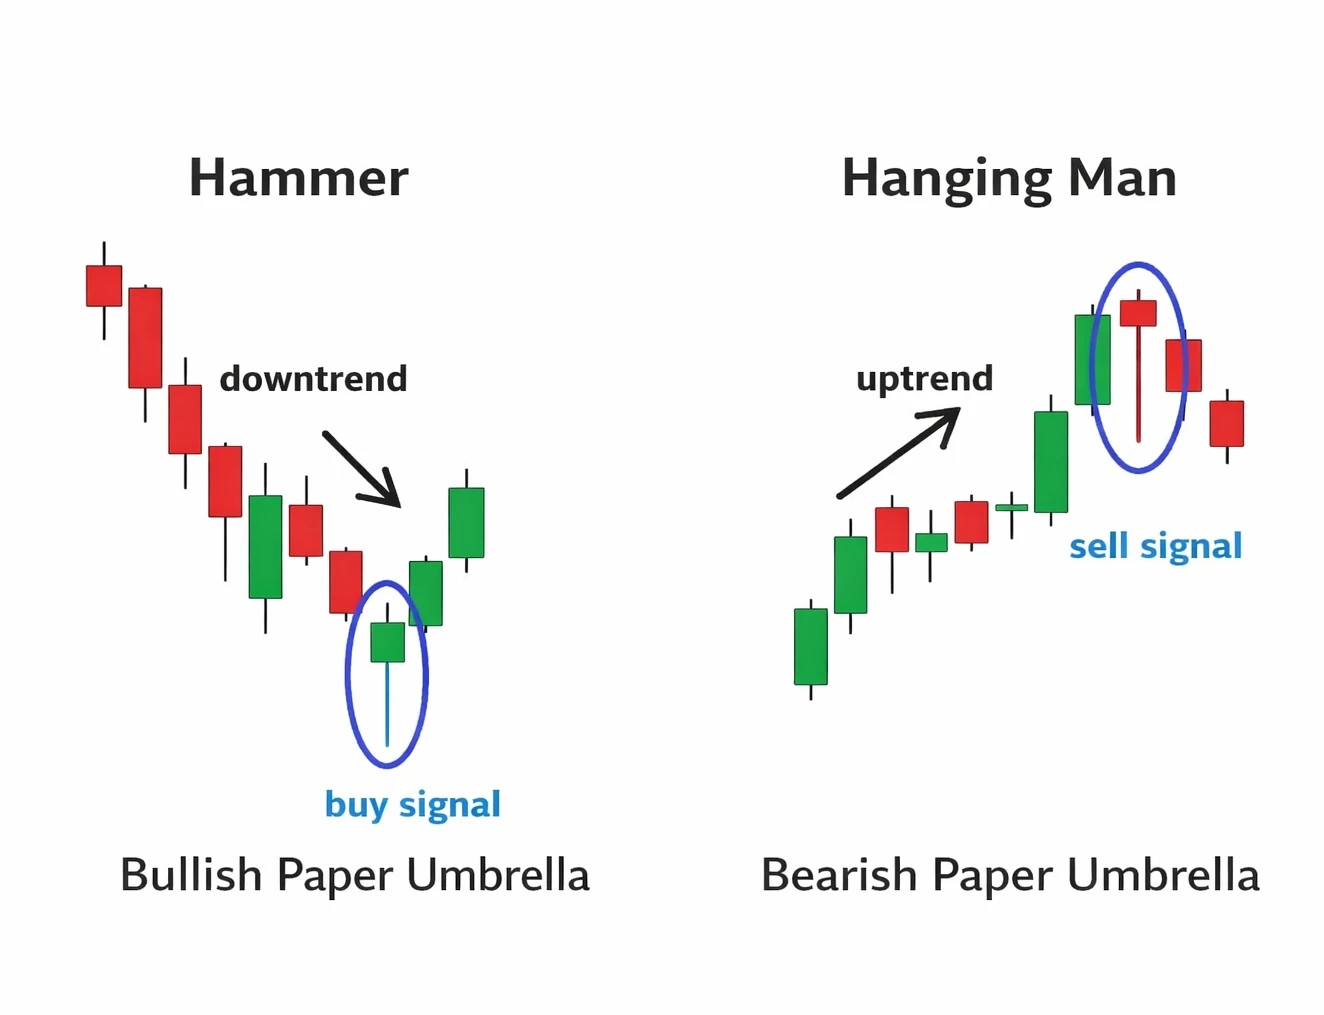
Bullish Paper Umbrella
When this candle appears at the bottom of a downtrend, it may suggest:
- Sellers are losing momentum
- Buyers are starting to step in
- A potential bullish reversal environment
This structure reflects the presence of demand in the market.
Bearish Context of Paper Umbrella
If a similar candle appears during an uptrend, it may simply reflect temporary volatility rather than a reversal.
Traders usually wait for additional confirmation before interpreting the candle as a signal of trend change.
Application in Market Analysis
Professional traders combine this candle with:
- Support levels
- Trend direction
- Market structure analysis
These factors help determine whether the candle reflects real buying pressure or temporary liquidity movement.
5. Shooting Star Candle
A Shooting Star candle has a long upper shadow and a small body near the bottom of the candle.
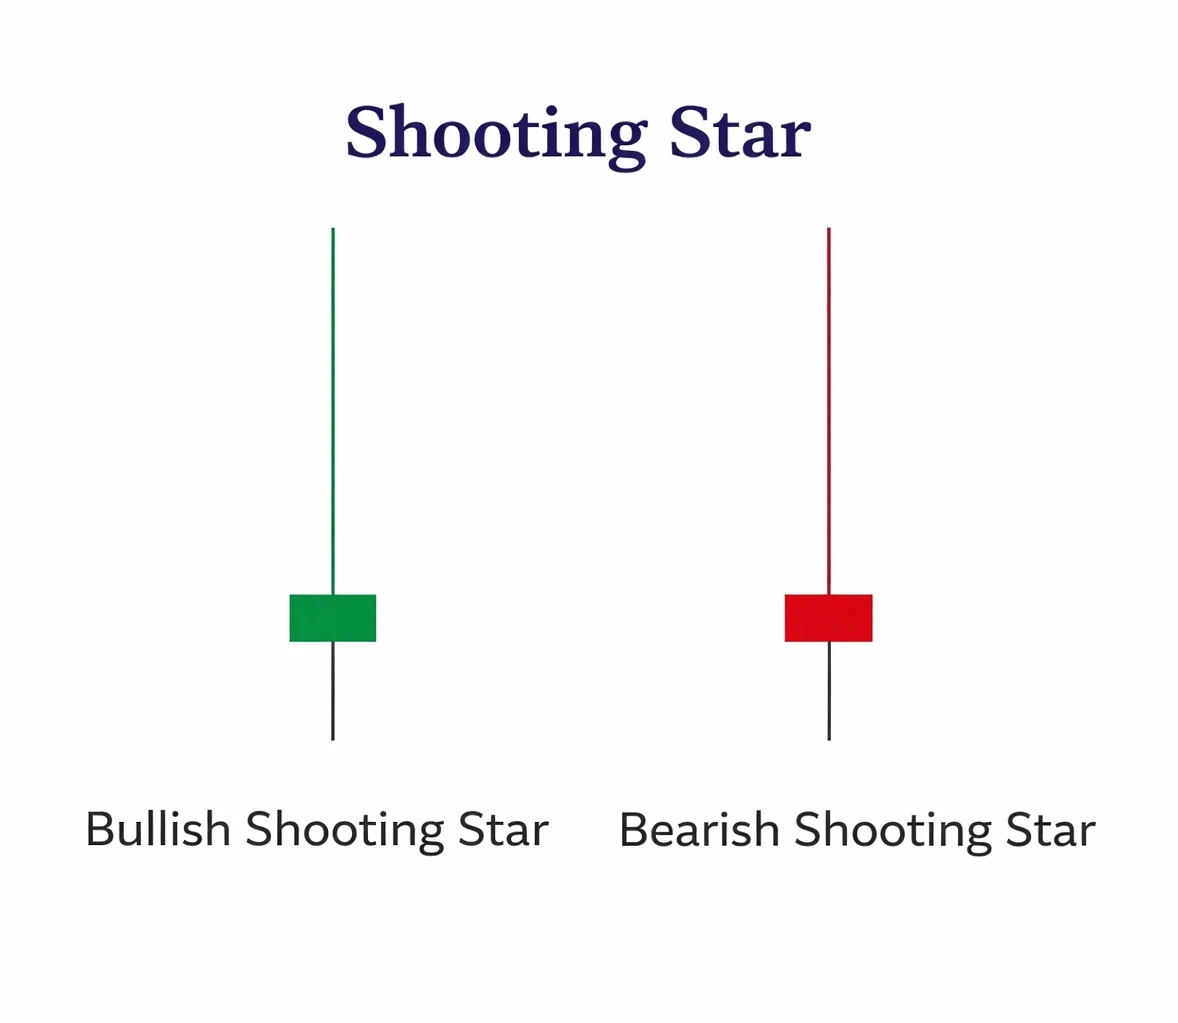
What Happens in This Candle
During the trading period:
- Buyers push price higher initially
- Sellers later push price back downward
- The candle closes near the lower portion of the range
This indicates that selling pressure appeared after a price rise.
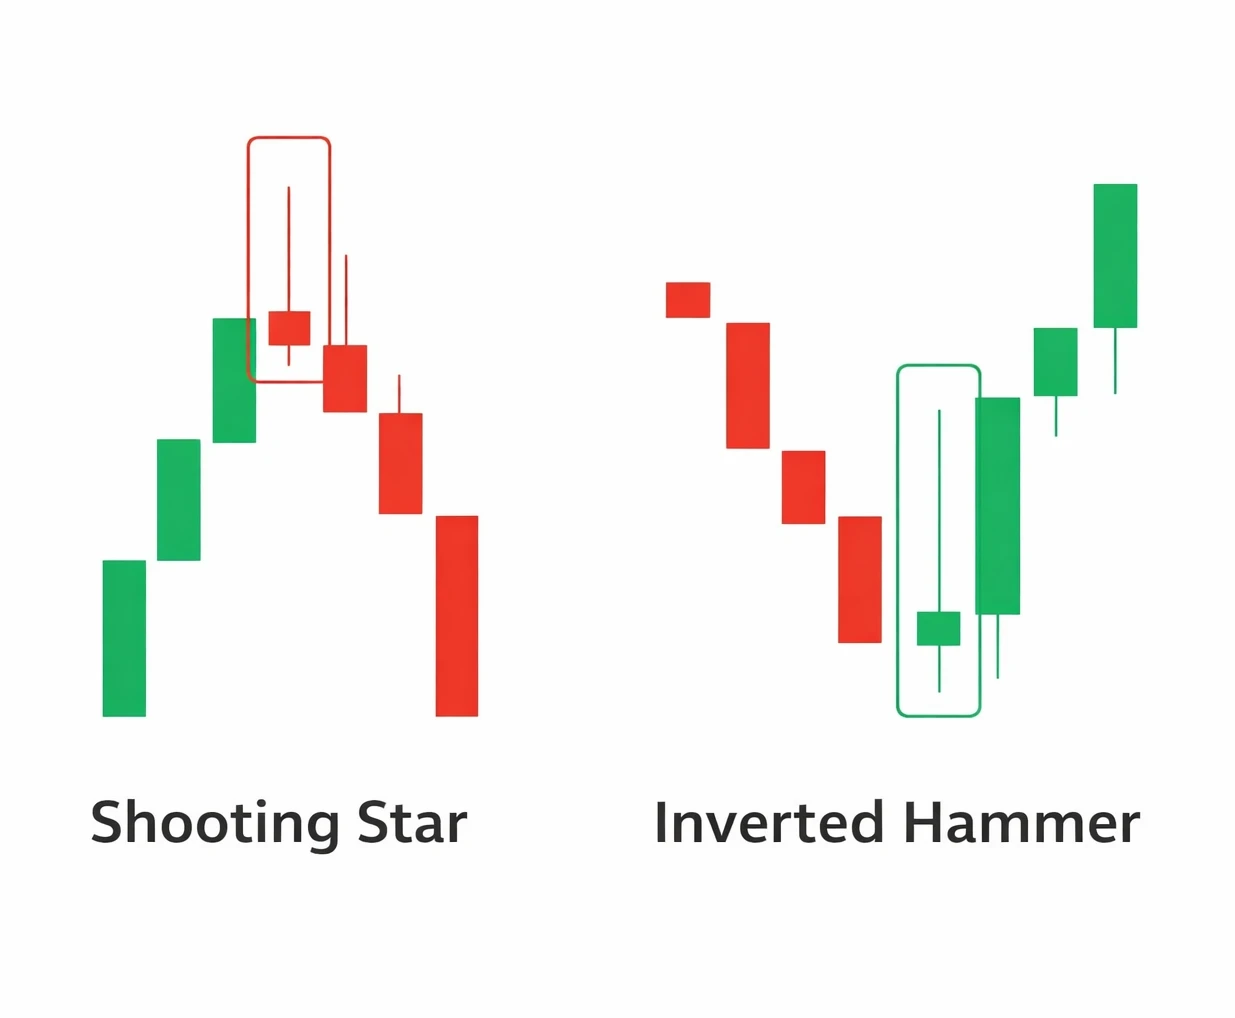
Bearish Shooting Star
When a shooting star appears at the top of an uptrend, it may indicate:
- Buyers are losing strength
- Sellers are gaining control
- Possible bearish reversal conditions
This candle is often observed near resistance levels or liquidity zones.
Bullish Context of Shooting Star
If the same structure appears during a downtrend, it may simply reflect short-term volatility rather than a clear reversal signal.
Application in Market Analysis
Traders combine shooting star candles with:
- Resistance levels
- Trend exhaustion signals
- Broader market structure analysis
As explained earlier in Chapter 3 when discussing how traders enter the forex market, risk management and position sizing are essential because no single candle guarantees a market move 🔗https://tradetogether.in/articles/start-forex-trading-safely-beginners-demo-real-funded .
Comparison of Common Candle Types
| Candle Type | Market Behavior | Key Structure |
|---|---|---|
| Marubozu | Strong directional momentum from buyers or sellers | Large body with little or no upper and lower wicks |
| Doji | Market indecision where buyers and sellers are balanced | Very small body with long upper and lower shadows |
| Spinning Top | Temporary balance between buyers and sellers during the session | Small body with both upper and lower wicks |
| Paper Umbrella | Buyers push price upward after strong selling pressure | Small body near the top with a long lower shadow |
| Shooting Star | Sellers push price downward after strong buying pressure | Small body near the bottom with a long upper shadow |
What Traders Should Learn from Candlestick Types
Candlestick types are useful because they help traders understand market psychology and price behavior. However, professional trading decisions are rarely based on a single candle alone.
Traders usually combine candlestick analysis with:
- Market structure
- Support and resistance levels
- Trend direction
- Liquidity analysis
- Risk management
For example, many traders limit risk by using proper position sizing and stop-loss protection, ensuring that a single market move does not significantly affect their trading capital.
Frequently Asked Questions
What does a Doji candle indicate?
A Doji candle usually indicates market indecision, where buyers and sellers are equally balanced during the period.
Is a Marubozu candle always a strong signal?
A Marubozu candle often shows strong momentum, but traders confirm it using trend analysis and support/resistance levels.
Can a single candlestick predict market direction?
No. Candles provide information about market behavior, but reliable analysis requires multiple confirmations.
Are candlestick types used in all markets?
Yes. Candlestick analysis is widely used in forex, stock markets, cryptocurrency markets, and commodities.
Conclusion
Candlestick types provide valuable insight into how buyers and sellers interact in the market.
By studying candle structure, traders begin to understand market sentiment, volatility, and price behavior.
However, successful trading requires combining candlestick analysis with risk management, market structure understanding, and broader market context.

Written by
Trade Together Research
Trade Together Research is a professional market analysis team providing forex, gold, and crypto trading insights, technical analysis, and educational guides.. Learn more about our research team on the About page.