USDJPY Forex Analysis – September 1, 2026: Rejection From Resistance Signals Downside Momentum
Tue Sep 01 2026
More analysis for this pair:
View all USDJPY market analysis →Forex forecast for this pair:
View USDJPY forecast →USDJPY Market Context
USDJPY is showing a notable reaction around the 160.127–160.285 resistance area identified on the 1-hour chart.
This zone had previously acted as an area of resistance. When price returned to the region, the market showed a clear rejection, followed by strong bearish movement on the 1-hour timeframe.
This reaction is important because it shows that sellers became active again around a previously significant price area.
Higher-Timeframe Structure
On the 1-hour chart, the highlighted resistance zone provides the broader context for the current USDJPY setup.
Price moved back into this area and produced a strong rejection. The following bearish candles increased the downside momentum and shifted short-term structure away from the resistance region.
Rather than treating the reaction as a prediction of what must happen next, the important observation is how price behaves after interacting with this higher-timeframe area.
The key reference levels from the chart are:
- Resistance zone: 160.127–160.285
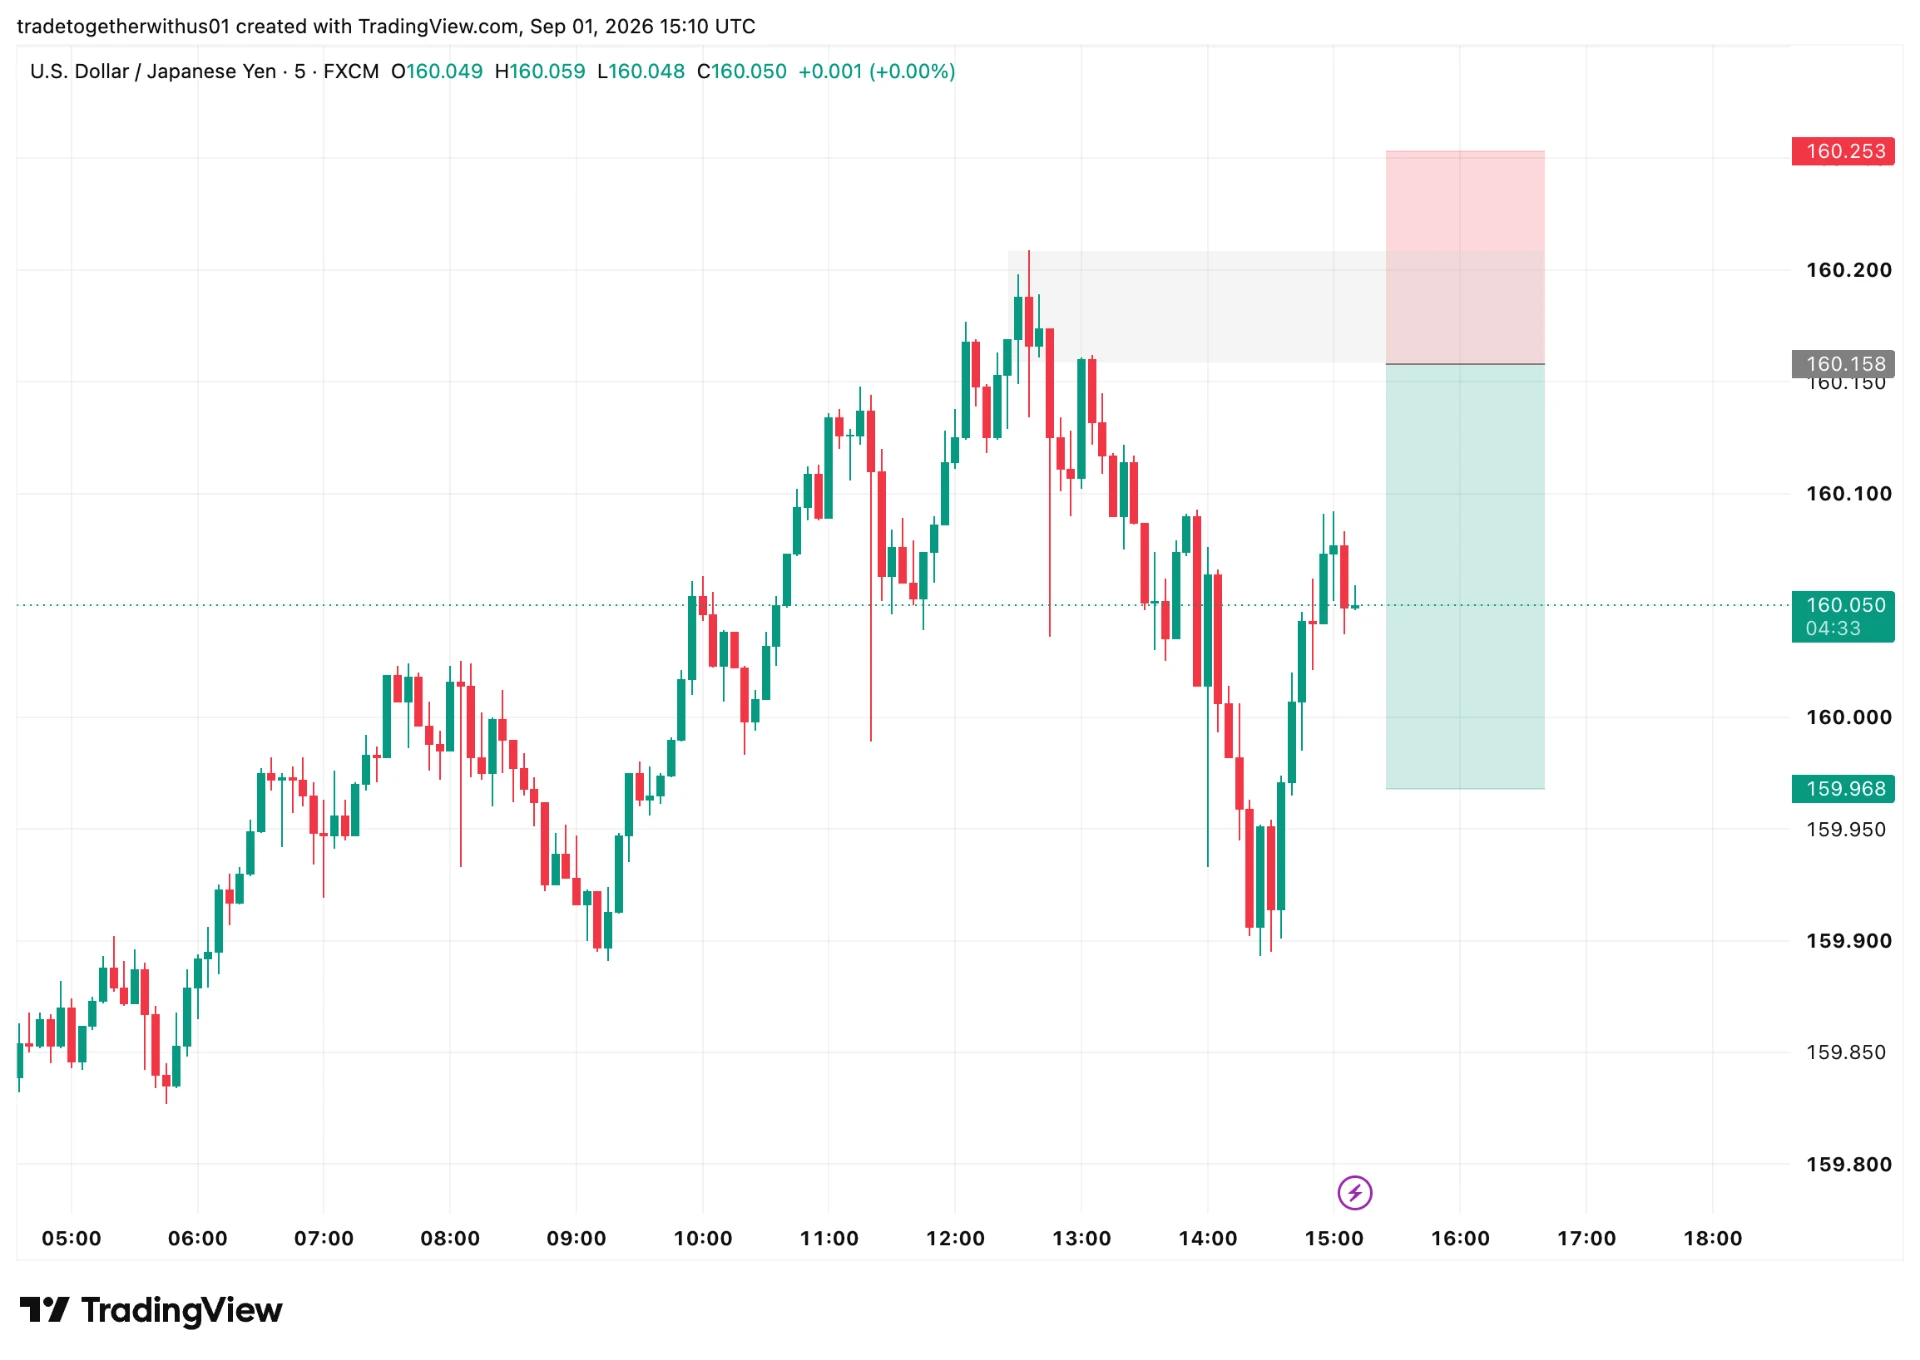
- Current technical reference area: around 160.158
- Risk invalidation boundary: around 160.253
- Potential downside objective: around 159.997
These levels represent the marked technical structure from the analysis and should not be interpreted as guaranteed future price levels.
5-Minute Market Structure
After moving to the 5-minute timeframe, the bearish movement became clearer.
Price developed a downside structural shift following the rejection from the 1-hour resistance area. This provided additional confirmation that the short-term order flow was no longer behaving in the same way as it had while price was approaching the resistance.
Following this movement, a smaller area of interest developed on the 5-minute chart.
The marked 160.158 region represents the technical area we are monitoring for a potential continuation of the observed downside structure.
The chart also shows a defined risk boundary around 160.253, while the lower reference level is positioned near 159.997.
Why This USDJPY Setup Is Interesting
The strength of this analysis comes from the combination of two timeframes rather than from a single indicator.
The sequence is straightforward:
1-hour resistance → rejection → strong bearish movement → 5-minute structural shift → lower-timeframe area of interest
This type of alignment allows the higher timeframe to provide context while the lower timeframe is used to study the developing price structure.
However, market structure can change quickly, particularly during active trading sessions or around major economic events. The setup therefore remains conditional on price continuing to respect the observed structure.
Invalidation and Risk Considerations
The bearish structure would become less relevant if price moves back through the defined invalidation region and begins establishing acceptance above the resistance area.
The marked 160.253 level is therefore used as a structural risk boundary in this analysis.
The distance between the reference area and this boundary represents the defined risk framework, while the lower 159.997 region represents the chart's potential objective.
A technical setup does not guarantee that price will reach any particular level. Slippage, spread, volatility, economic releases and changing liquidity can all affect actual trading outcomes.
This analysis is provided for educational and informational purposes only and should not be considered investment advice or a recommendation to buy or sell any financial instrument.
What Traders Should Watch Next
The most important thing to observe is how USDJPY behaves around the marked resistance and lower-timeframe area.
Traders can watch for:
- Whether price continues to respect the 1-hour resistance zone.
- Whether the 5-minute bearish structure remains intact.
- Whether price accepts back above the resistance region.
- How momentum behaves as price approaches the lower reference area.
- Whether volatility changes during major market sessions or economic events.
The key lesson is that the higher timeframe gives the context, while the lower timeframe helps us understand how price is behaving inside that context.
How We Approach USDJPY at TradeTogether
At TradeTogether, we focus on observing what the market is actually doing rather than forcing every market into one fixed strategy.
In this USDJPY analysis, the higher-timeframe resistance provides the initial context, while the 5-minute structure helps us evaluate the developing price action.
We continuously adapt our analysis as market conditions evolve.
For regular market analysis and timely updates, follow TradeTogether on Instagram
If you want to build your Forex knowledge systematically, explore our Forex Foundation Masterclass, which organizes Forex concepts in a step-by-step learning path.
For the psychological side of trading, our Trader Psychology Series covers discipline, mindset and the challenges traders face while operating in the market.
Conclusion
USDJPY is currently showing a notable bearish reaction from the 160.127–160.285 1-hour resistance area, followed by a downside structural shift on the 5-minute timeframe.
The important feature of this analysis is the alignment between the higher-timeframe resistance and the lower-timeframe price structure.
As always, the market can invalidate any technical scenario. Price should therefore be monitored dynamically rather than treated as a predetermined outcome.
Explore more analysis from this trading session:
View all newyork Session Analysis →Explore more forex forecasts and market outlooks:
View Forex Forecast Hub →Forex forecast for this session:
View USDJPY newyork Session Forecast →
Written by
Trade Together Research
Trade Together Research is a professional market analysis team providing forex, gold, and crypto trading insights, technical analysis, and educational guides.. Learn more about our research team on the About page.