XAUUSD 2H Market Structure Analysis – Wednesday, April 22, 2026
Wed Apr 22 2026
More analysis for this pair:
View all XAUUSD market analysis →Forex forecast for this pair:
View XAUUSD forecast →Market Context
Gold (XAU/USD) continues to be one of the most closely monitored assets in global financial markets. The metal often reacts strongly to changes in interest rate expectations, inflation outlook, geopolitical developments, and movements in the US dollar. Because of its role as a global store of value, gold frequently shows clear reactions around historically significant technical zones.
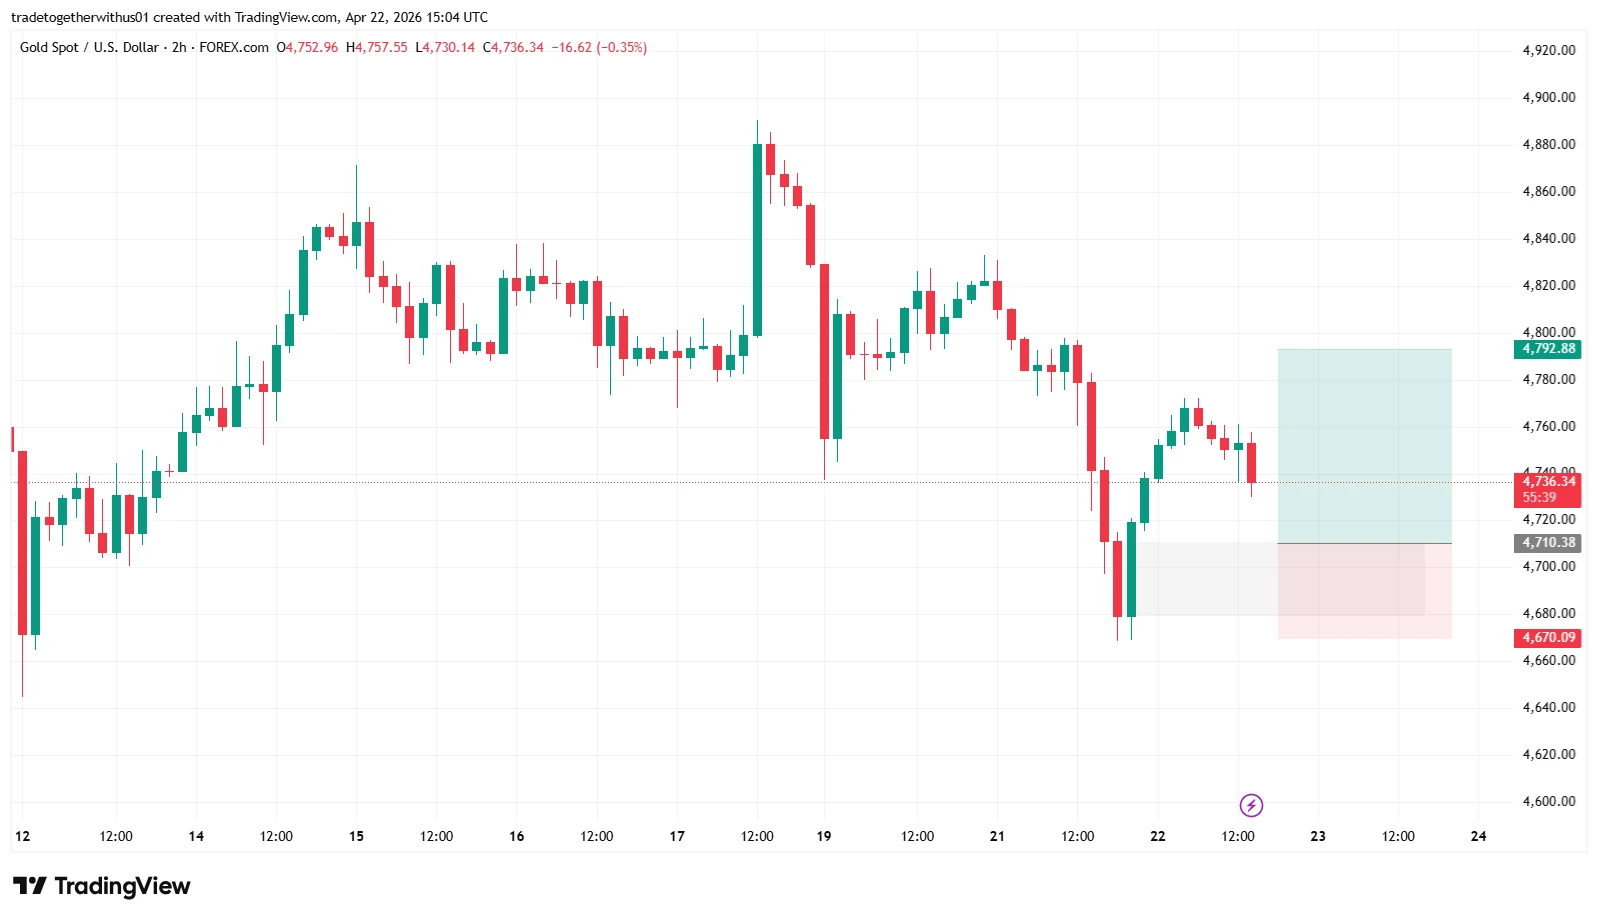
The current 2-hour chart structure highlights how price recently revisited a previously respected support region and responded with renewed upward momentum. Rather than presenting a directional prediction, this analysis focuses on how institutional price zones, liquidity behavior, and imbalance dynamics may influence the market structure.
Understanding these structural reactions helps traders observe how price transitions between liquidity zones and key technical levels.
Higher Timeframe Structure Context
Before analyzing a lower timeframe chart, professional analysts typically review the broader structural environment.
Leading up to the current reaction, gold displayed several notable characteristics:
- A strong bullish expansion phase
- A corrective movement after the rally
- Multiple reactions near a historically respected support region
These types of corrections often occur when markets rebalance liquidity after a strong directional move. The horizontal level highlighted on the chart represents an area where price has reacted several times previously, indicating that market participants have historically shown interest in this zone.
Such zones frequently behave as structural reference levels where liquidity accumulates and market participation increases.
Current 2-Hour Chart Structure and Key Observations
On the 2-hour XAU/USD chart, price recently retraced toward this previously respected support area. After reaching this region, the market displayed several structural developments.
Key observations include:
-
A clear reaction from the previously respected support region
-
A strong impulsive upward movement following the reaction
-
The formation of price imbalances during the upward expansion
-
A gradual retracement as price begins interacting with those imbalance areas again
This sequence represents a common market pattern where price reacts from a structural level, expands rapidly, and later revisits imbalance areas to rebalance liquidity.
Such behavior is often observed in highly liquid markets like gold, where institutional participation plays a significant role in shaping price movements.
Understanding the Highlighted Structural Zones
The chart highlights several areas that help explain the market’s current positioning.
Previously Respected Support Region
The lower horizontal level represents a historical support region where price has reacted multiple times in the past.
These areas become important because they often represent:
- Zones where large participants previously accumulated positions
- Areas where liquidity has historically been absorbed
- Regions where the market previously transitioned from selling pressure to buying interest
In technical analysis, these types of zones are often identified through support and resistance structures, which help traders recognize where price may react again.
For readers who want to understand this concept in greater depth, see our guide: Support and Resistance in Forex Trading — How to Identify Key Price Levels (Chapter 10).
Understanding how support and resistance levels develop can provide important context when analyzing structural reactions like the one seen in the current gold chart.
Imbalance and Fair Value Gap Areas
During the strong upward movement after the reaction, the chart shows signs of price imbalance, sometimes referred to as fair value gaps.
These imbalances occur when price moves quickly in one direction, leaving areas on the chart where limited trading activity occurred.
Markets often revisit these zones because price tends to rebalance inefficient movements over time. The current pullback appears to be interacting with such an imbalance region created during the earlier momentum expansion.
Upper Liquidity Region
The higher shaded area on the chart represents a liquidity region above the current market structure.
These areas often correspond with:
- Prior short-term highs
- Areas where pending orders may accumulate
- Regions where volatility could increase if price approaches
However, these zones should always be treated as areas of structural interest rather than predetermined outcomes.
What Market Participants May Watch Next
Following the recent structural reaction, analysts typically monitor several evolving factors:
- Whether the support region continues to attract participation
- How price interacts with recent imbalance areas
- The development of short-term higher lows
- Possible formation of range-bound consolidation patterns
Observing these elements can provide insight into how liquidity continues to flow through the market.
Key Learning Takeaway
This chart provides a practical example of how several important technical concepts can align within a single market movement:
- Reactions from historically respected support zones
- Momentum expansion following liquidity absorption
- Formation and rebalancing of price imbalances
- Interaction with nearby liquidity clusters
Rather than attempting to predict exact outcomes, traders can benefit from focusing on how price moves between liquidity zones and how structural reactions develop over time.
This perspective encourages probability-based thinking, patience, and disciplined risk management.
Explore more analysis from this trading session:
View all newyork Session Analysis →Explore more forex forecasts and market outlooks:
View Forex Forecast Hub →Forex forecast for this session:
View XAUUSD newyork Session Forecast →
Written by
Trade Together Research
Trade Together Research is a professional market analysis team providing forex, gold, and crypto trading insights, technical analysis, and educational guides.. Learn more about our research team on the About page.