Support and Resistance in Forex Trading — How to Identify Key Price Levels (Chapter 10)
Tue Mar 17 2026
1. Introduction to Support and Resistance
In earlier discussions about trading basics, we explored how prices move and how traders interpret market behavior using charts and trends. These tools help traders understand the interaction between buyers and sellers in the market.
However, price movements do not occur randomly. Markets often react repeatedly around certain price levels. These levels are known as support and resistance.
Support and resistance are among the most widely used concepts in technical analysis because they help traders understand where price reactions are more likely to occur.
When traders observe price charts, they often notice that prices tend to slow down, pause, or reverse around specific areas. These areas represent zones where buyers and sellers previously showed strong interest.
Understanding these levels helps traders interpret market structure, liquidity behavior, and supply-demand dynamics more clearly.
2. In This Chapter You Will Learn
In this chapter, you will learn the core concept of support and resistance, which are fundamental elements of price action trading.
By the end of this chapter, you will understand:
- What support means in financial markets
- What resistance means and why price reacts there
- Why these levels are important in trading
- Why support and resistance often influence price movement
- Why these levels sometimes fail
- How traders identify support and resistance on charts
These ideas form an important foundation for understanding market structure and price behavior.
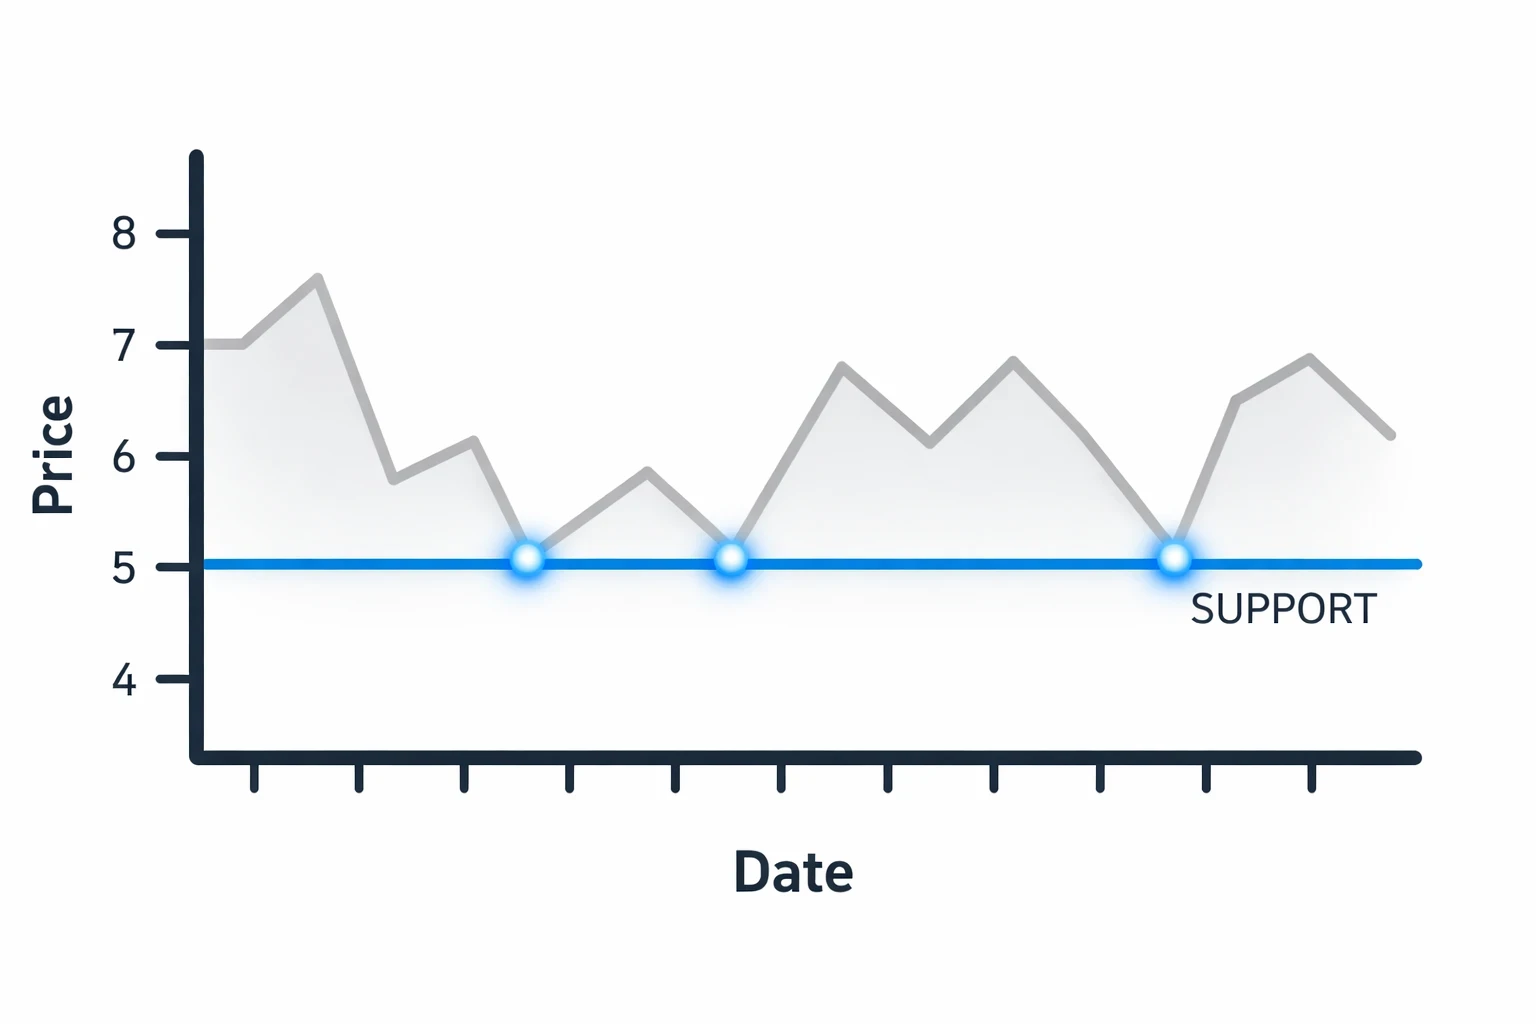
3. What is Support?
Support is a price level where buying pressure tends to appear, preventing the price from falling further for a a period of time. At support levels:
- Buyers believe the asset is relatively cheap or attractive
- Traders may close their sell positions
- Demand begins to increase
When demand becomes stronger than supply, price may stop falling and move upward.
For example, imagine a currency pair falling toward a level where it previously reversed several times. When price reaches that area again, many traders expect a similar reaction and begin placing buy orders. This increased demand can slow down the downward movement.
Very often, traders also watch for bullish candlestick signals near support levels to confirm potential reversals. If you are new to candlestick reading, you can learn the basics in our guide on How to Read Candlestick Charts for Beginners 🔗https://tradetogether.in/articles/how-to-read-candlestick-charts-beginners-bullish-bearish.
It is important to understand that support does not guarantee a price increase. Instead, it represents a zone where buying interest may appear.
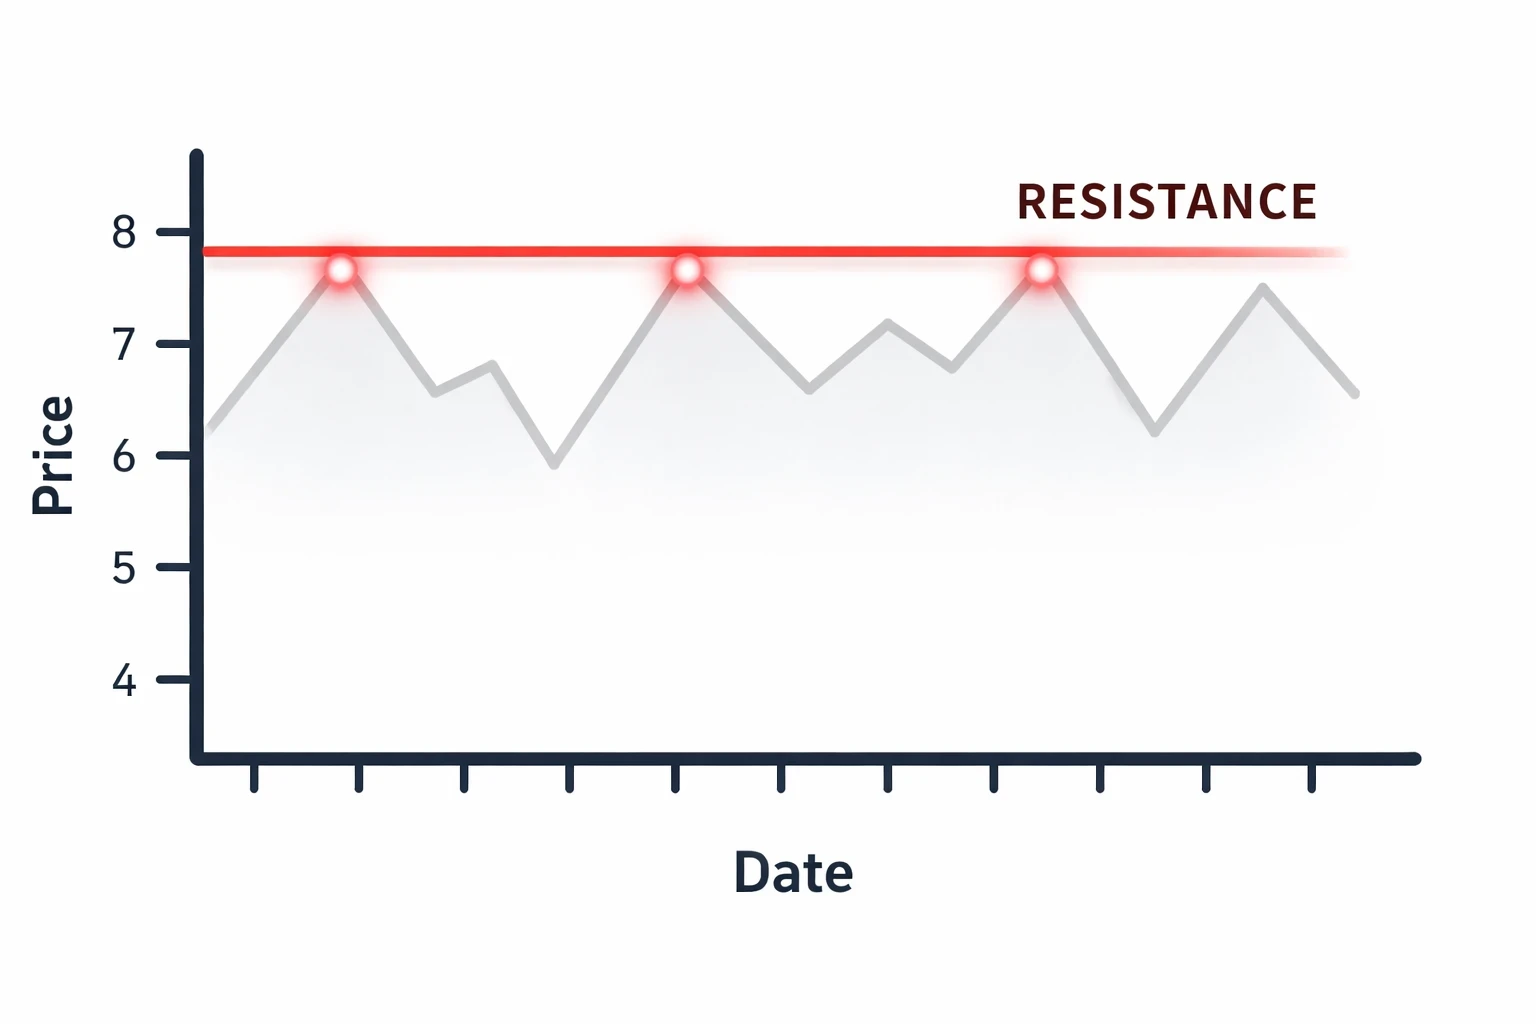
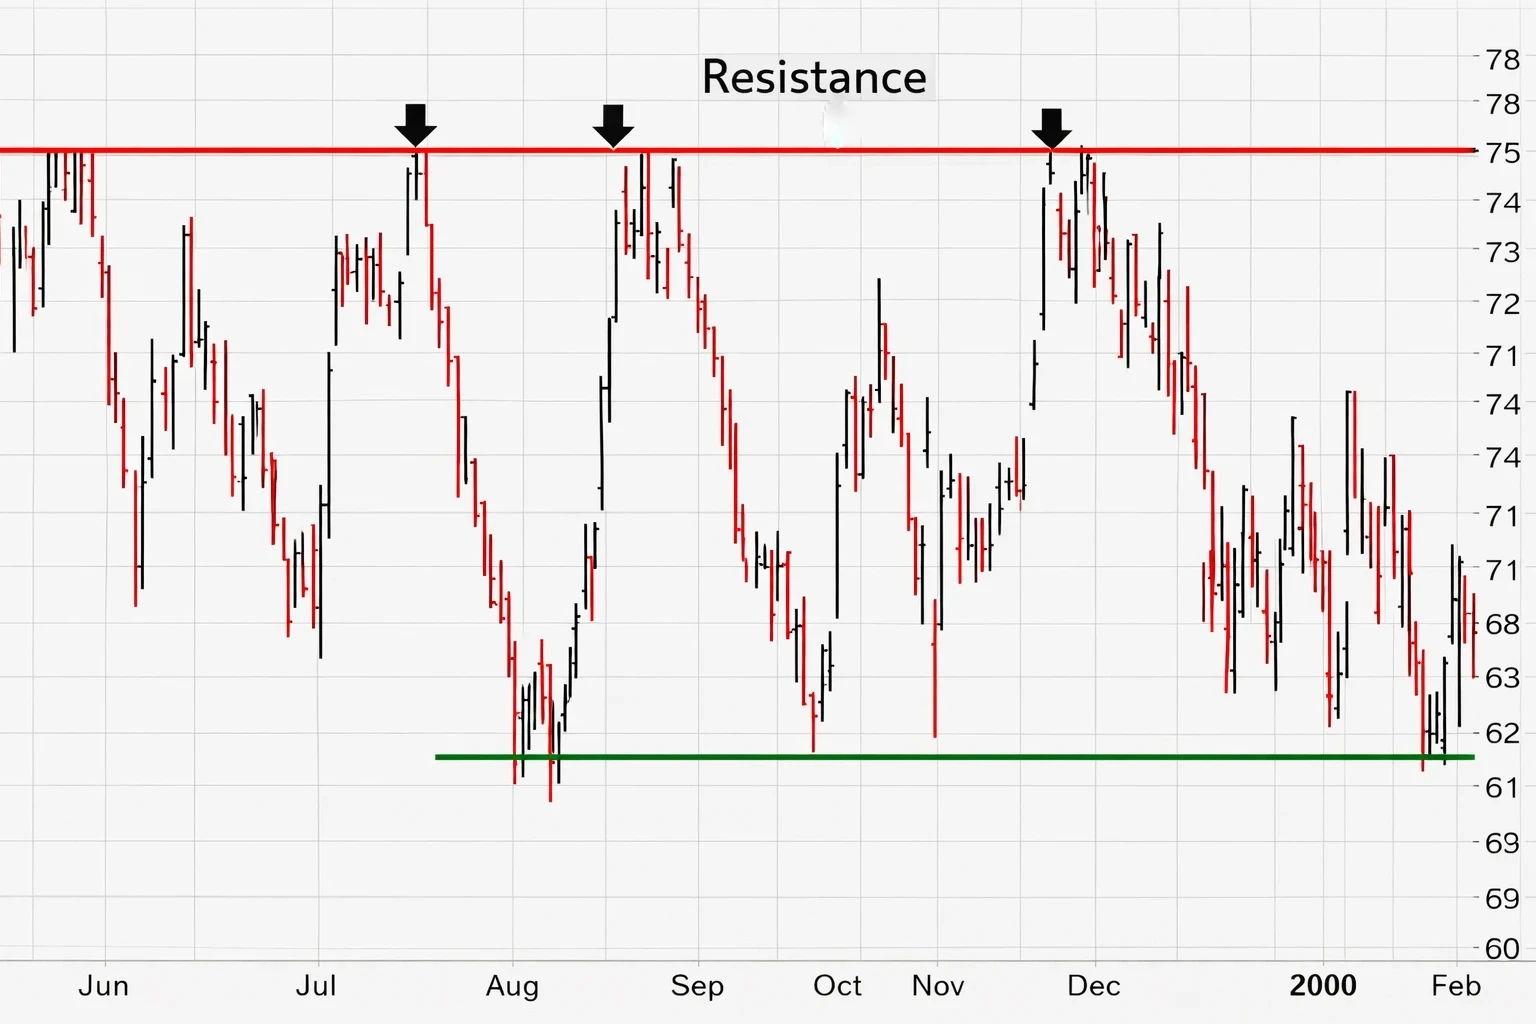
4. What is Resistance?
Resistance is the opposite of support. It is a price level where selling pressure tends to increase, preventing price from rising further. At resistance levels:
- Some traders believe the asset has become expensive
- Traders may take profits from earlier purchases
- Supply begins to increase
When supply becomes stronger than demand, price may stop rising and begin to decline.
For example, if a currency pair rises to a level where price previously struggled to move higher, traders may expect a similar reaction again and begin placing sell orders.
Certain candlestick patterns such as Doji or Spinning Top sometimes appear near resistance levels and indicate market hesitation. These patterns are explained in our article Candlestick Types Explained: Marubozu, Doji, Spinning Top 🔗https://tradetogether.in/articles/candlestick-types-explained-marubozu-doji-spinning-top.
Resistance also represents a zone of potential price reaction, not a guaranteed reversal point.
5. Why Support and Resistance Are Important
Support and resistance levels help traders understand how the market behaves around important price zones.
These levels provide insights into:
- Where buyers may enter the market
- Where sellers may become active
- Where price might pause or reverse
- Where traders previously reacted
Markets are influenced by human behavior and trader expectations. When price returns to previously important levels, traders often anticipate similar reactions.
These levels also become more meaningful when they align with the overall market trend. For example, in an uptrend, support levels often act as areas where buyers re-enter the market. To understand trend direction more clearly, you can review Trend Analysis in Forex: Uptrend, Downtrend, and Sideways Markets 🔗 https://tradetogether.in/articles/trend-analysis-forex-uptrend-downtrend-sideways.
Because many traders watch the same price levels, these zones can become areas of increased market activity.
6. Why Support and Resistance Work Most of the Time
Support and resistance often work because they reflect market psychology and order flow.
When price reaches a support level:
Some traders believe the asset is undervalued and begin buying. Others close their sell positions. This increases demand and price may move upward.
At resistance levels:
Some traders believe the asset is overvalued and begin selling. Others close their buy positions. This increases supply and price may move downward.
Because many traders observe similar levels, these areas often become self-reinforcing zones where price reactions occur.
7. Why Support and Resistance Sometimes Fail
Although these levels often influence price movement, they do not always work.
Financial markets constantly react to new information, economic events, and institutional trading activity.
Support or resistance can break when:
- Major economic news is released
- Central bank policy changes occur
- Strong institutional orders enter the market
- Market sentiment changes rapidly
In these situations, price may move through support or resistance instead of reversing.
Professional traders therefore treat these levels as areas of probability rather than certainty.
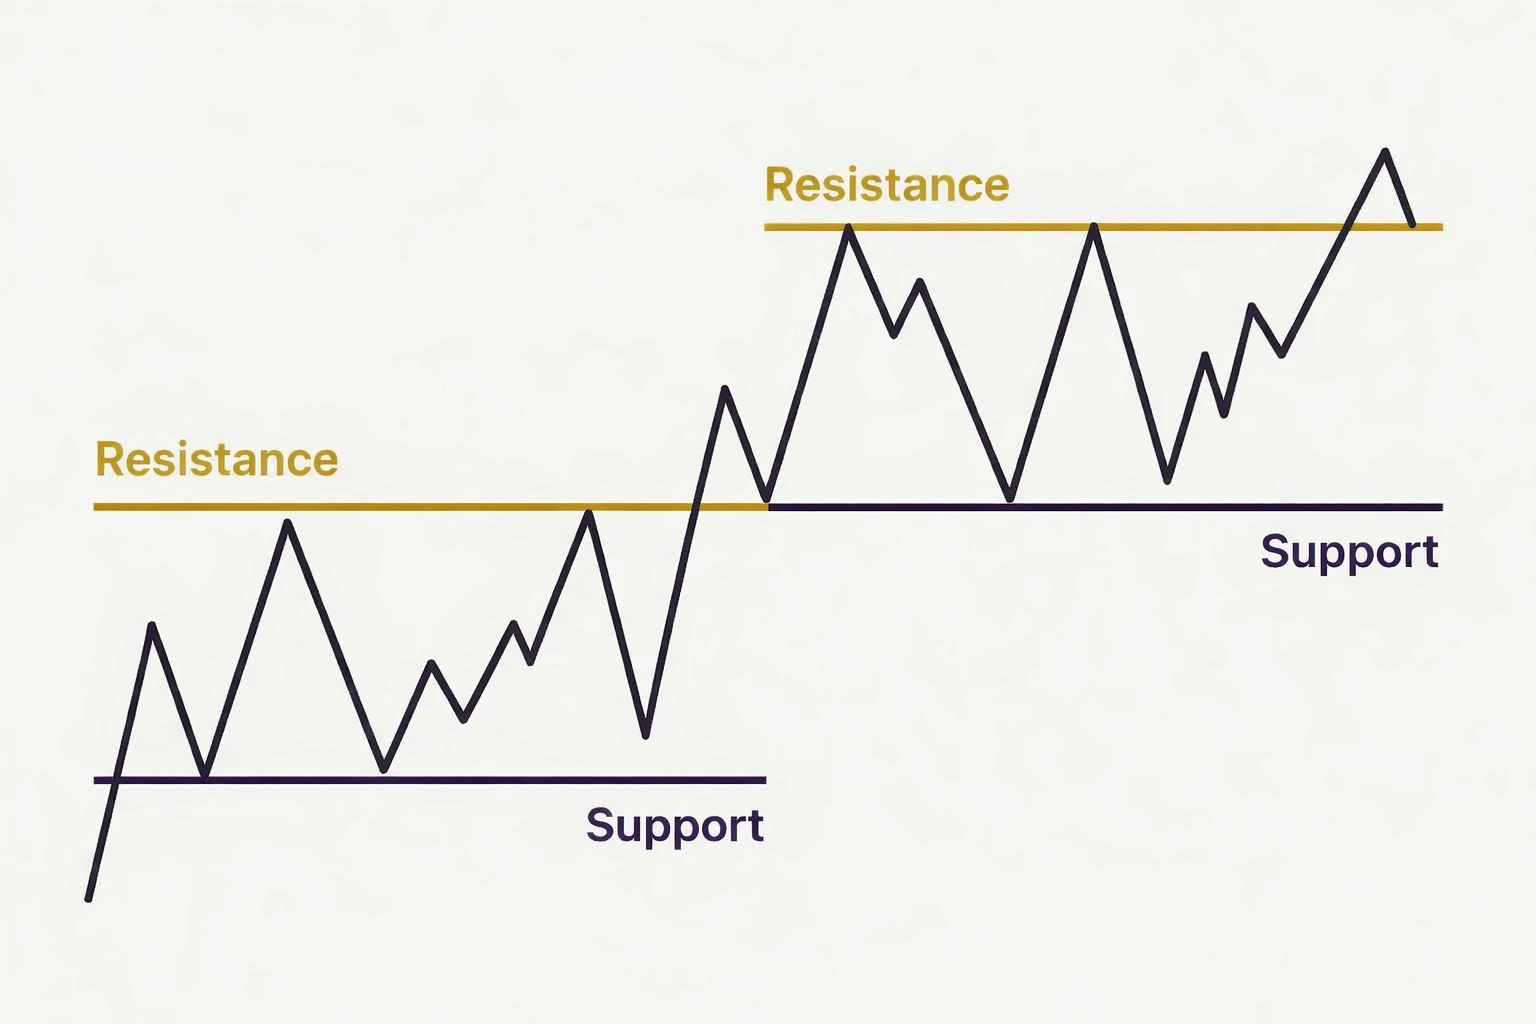
8. Role Reversal: When Support Becomes Resistance
An important concept in market structure is role reversal.
Role reversal happens when a support level turns into resistance, or when a resistance level turns into support, after price breaks through that level.
To understand this easily, imagine the market levels like floors and ceilings in a building.
A support level acts like a floor. When price falls and reaches this level, it often stops falling because buyers step in and start buying.
A resistance level acts like a ceiling. When price rises and reaches this level, it often struggles to move higher because sellers begin selling.
However, sometimes the market becomes strong enough to break through these levels.
When Support Becomes Resistance
If price breaks below a support level, that level may later act as resistance.
This happens because traders who previously bought at that support level may now be holding losing positions. When price returns to that level again, many of them decide to sell to exit their trades. This new selling pressure can stop the price from rising further, turning the old support into a new resistance.
When Resistance Becomes Support
The opposite situation can also occur.
If price breaks above a resistance level, that level may later act as support.
Traders who missed the earlier upward move may wait for price to return to that level and see it as a good opportunity to enter buy trades.
This creates buying pressure, and the previous resistance level can now help support the price.
Why Role Reversal Happens
Role reversal happens mainly because of trader behavior and market psychology.
Many traders remember important price levels where strong reactions previously happened. When price returns to those levels again, traders often react by entering or exiting positions.
Because many traders watch the same levels, these areas often continue influencing price behavior even after they are broken.
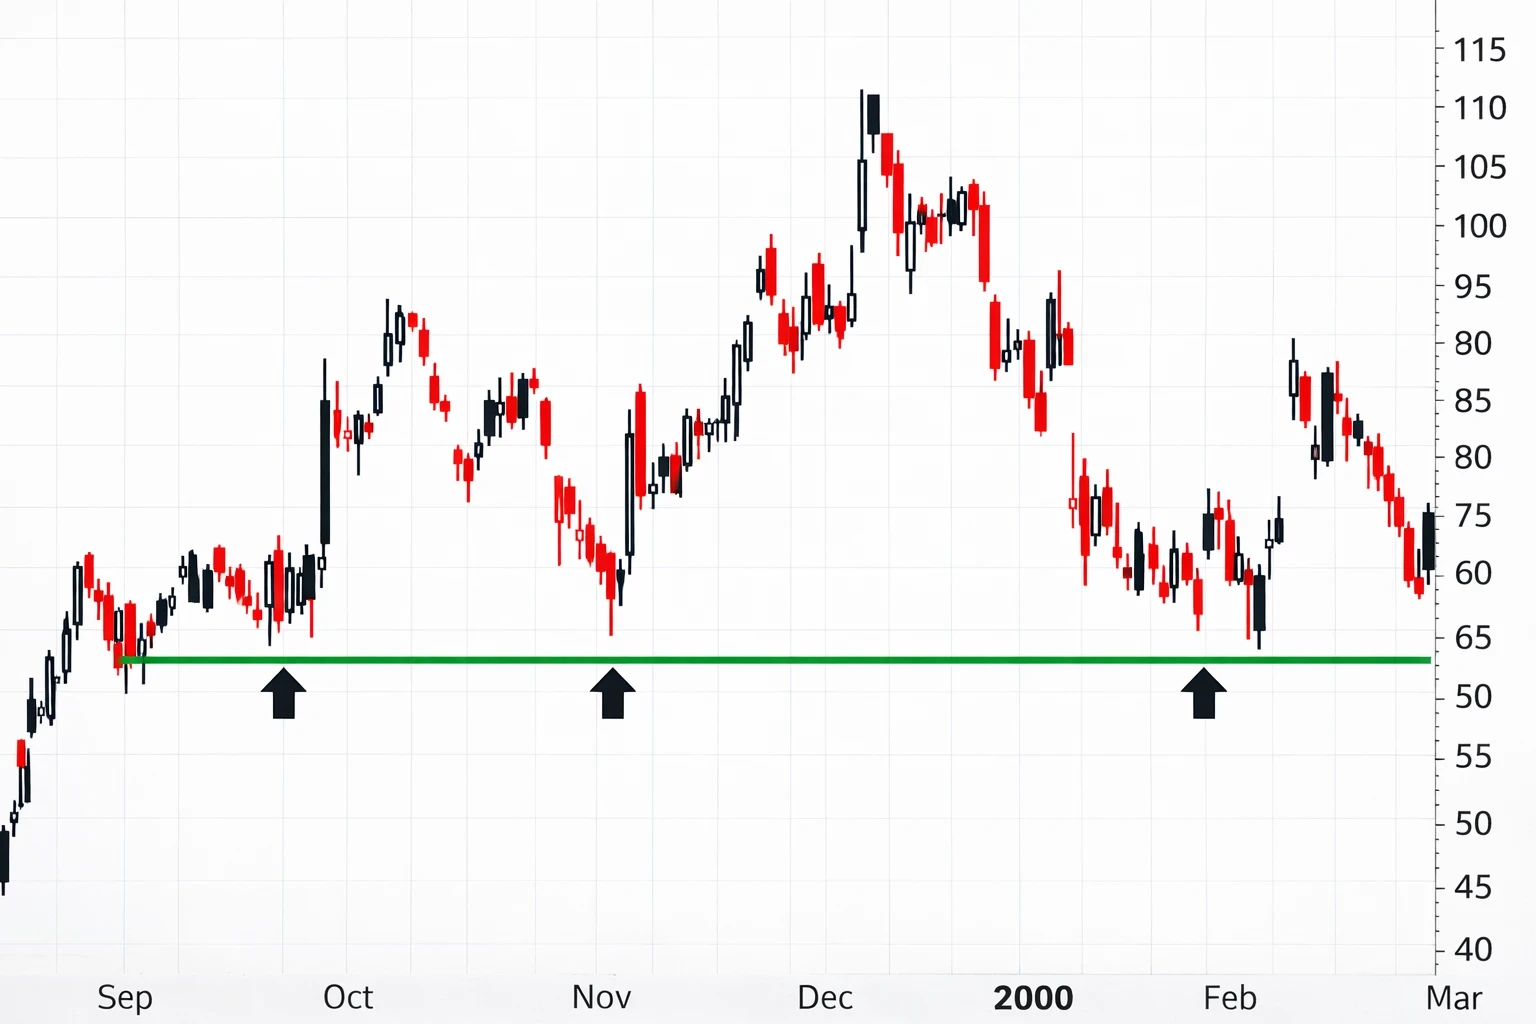
9. How Traders Identify Support and Resistance
Traders usually identify support and resistance by analyzing historical price behavior. Common techniques include:
- Observing previous highs and lows
- Identifying areas where price reacted multiple times
- Looking for clusters of price rejection
- Recognizing psychological levels such as round numbers
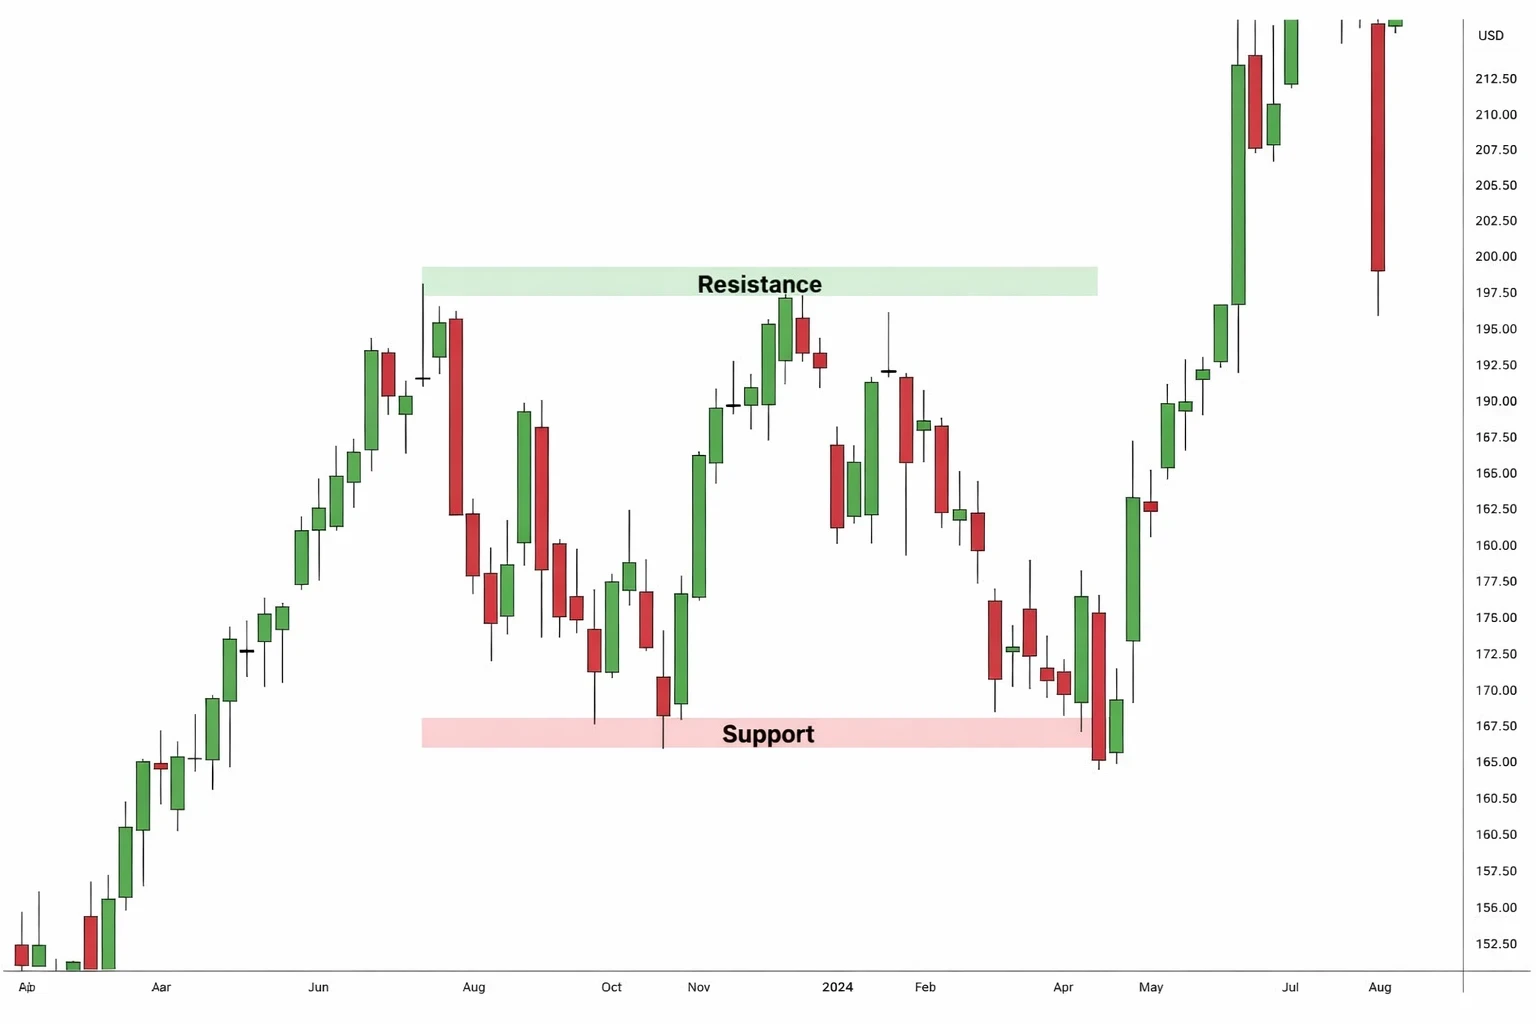
Support and resistance are generally zones rather than exact lines, meaning price may react within a range instead of a precise level.
10. Key Lessons Traders Should Remember
Support and resistance are powerful tools for understanding market behavior, but they should be used carefully.
Important principles include:
- Support and resistance represent reaction zones
- They provide probabilities, not guarantees
- They work best when combined with trend analysis
- Risk management is essential in every trade
Traders often use stop-loss orders and proper position sizing to manage risk when trading near these levels.
Frequently Asked Questions
What is support in forex trading?
Support is a price level where buying pressure tends to increase, often slowing or stopping a price decline.
What is resistance in trading?
Resistance is a price level where selling pressure increases, often slowing or reversing upward price movement.
Do support and resistance levels always hold?
No. They represent areas where price may react, but strong market momentum or news events can cause price to break through them.
Why do traders watch support and resistance?
These levels help traders identify potential decision zones where buying or selling activity may increase.
Conclusion
Support and resistance are fundamental concepts in technical analysis. They help traders understand where price may react due to the interaction between buyers and sellers.
By studying historical price behavior, traders can identify important levels that reflect market psychology, supply and demand, and institutional activity.
However, traders must remember that these levels represent probabilities rather than guarantees. Combining support and resistance with proper risk management helps traders navigate the uncertainty of financial markets.

Written by
Trade Together Research
Trade Together Research is a professional market analysis team providing forex, gold, and crypto trading insights, technical analysis, and educational guides.. Learn more about our research team on the About page.