XAUUSD 1-Hour Technical Analysis – Tuesday, April 28, 2026: Gold Maintains Bearish Structure Inside Descending Channel
Tue Apr 28 2026
More analysis for this pair:
View all XAUUSD market analysis →Forex forecast for this pair:
View XAUUSD forecast →Market Context
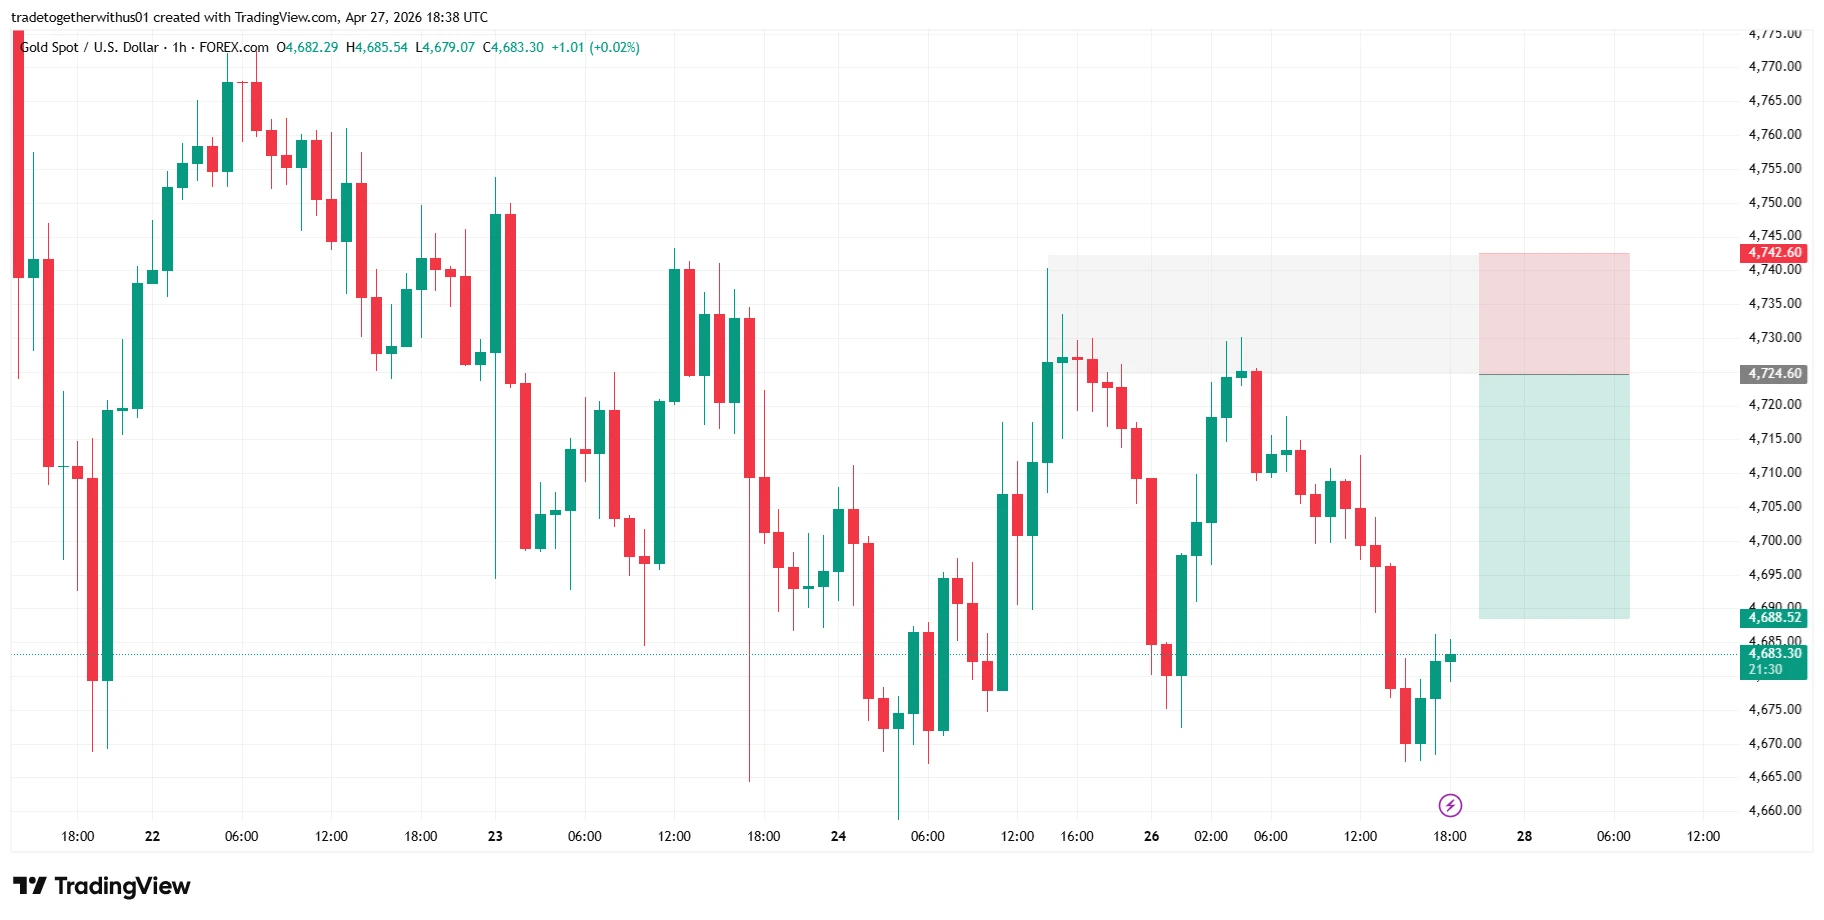
As of Tuesday, April 28, 2026, gold prices against the U.S. dollar (XAUUSD) continue to show a technically structured bearish environment on the 1-hour timeframe.
Recent price behavior indicates that momentum has shifted following a structural transition in the market, leading to a sequence of downward movements and controlled retracements.
The current chart highlights several institutional price areas that may influence short-term reactions while the broader directional bias remains shaped by market structure.
Higher Timeframe Structure Analysis
From a structural perspective, the 1-hour timeframe reflects a clear transition from bullish momentum to a developing bearish trend.
Earlier in the chart, a Change of Character (ChoCh) appears, which is commonly interpreted as the first signal that market control may be shifting. After this structural shift, price begins forming multiple Break of Structure (BoS) confirmations.
These structural developments create a pattern of lower highs and lower lows, which is widely recognized as a defining feature of a bearish market environment.
As the trend evolves, price action becomes contained within a descending channel, suggesting that while temporary retracements occur, the overall directional flow remains aligned with downward momentum.
Current Chart Structure and Key Observations
Within the descending channel, price movement displays a repeating pattern of corrective rallies followed by renewed downside pressure.
Several technical observations stand out in the chart:
- A clearly defined descending channel guiding price movement
- Multiple structural confirmations through lower highs and lower lows
- A retracement phase approaching a previously established institutional supply zone
- A significant reaction point near 4722, where strong bearish momentum previously emerged
These areas often represent locations where liquidity imbalances or institutional participation previously occurred.
Educational Explanation of the Marked Zones
The chart highlights three important structural regions that illustrate how technical analysts interpret market behavior.
Structural Reaction Zone
The highlighted region around 4724–4742 represents a supply area associated with a bearish order block combined with a fair value gap.
This zone formed following a strong impulsive downward move, suggesting that an imbalance between buyers and sellers occurred there. In many market structures, such areas become important reference zones when price later revisits them.
Structural Boundary Zone
The upper boundary near 4742.60 represents a technical area where the current bearish structure could face pressure. If price were to move beyond this level, it may indicate that the descending channel structure is weakening.
Downside Liquidity Zone
The region around 4688.52 represents a liquidity area where price previously slowed or reacted. Markets often gravitate toward such zones as participants reassess value within the prevailing trend.
These levels should be interpreted strictly as structural reference points used for educational analysis, rather than directional predictions.
What Market Participants May Watch Next
Looking ahead, several technical elements may influence how the market evolves:
- Reactions near the 4722 institutional zone
- Whether the descending channel structure remains respected
- Momentum strength during corrective rallies
- Price behavior around the 4688 liquidity region
Monitoring these factors can help market participants understand whether the current structure continues or begins to transition.
Learning Takeaway
This chart provides a practical example of how market structure analysis helps traders interpret price behavior.
Key lessons include:
- Structural shifts often begin with a change of character
- Break-of-structure sequences confirm emerging trends
- Order blocks and fair value gaps highlight areas of potential institutional activity
- Channels help visualize the broader directional flow of the market
Understanding these concepts allows traders to focus on market mechanics rather than emotional decision-making.
For traders looking to strengthen their technical understanding, structured learning and psychological discipline are essential components of long-term consistency.
You may explore deeper educational resources here:
Together, these two areas—technical knowledge and psychological discipline—form the foundation required for sustainable trading development.
Explore more analysis from this trading session:
View all newyork Session Analysis →Explore more forex forecasts and market outlooks:
View Forex Forecast Hub →Forex forecast for this session:
View XAUUSD newyork Session Forecast →
Written by
Trade Together Research
Trade Together Research is a professional market analysis team providing forex, gold, and crypto trading insights, technical analysis, and educational guides.. Learn more about our research team on the About page.