Chapter 20: Price Action Trading Explained for Forex Beginners (Chart Reading Guide) – Part 1
Thu Apr 16 2026
Introduction
In the previous chapters of this course, we studied how traders analyze the market using technical indicators such as Moving Averages, RSI, and MACD. These tools help traders interpret market momentum, trend direction, and potential trading conditions.
If you are new to this course, you can explore the full learning sequence in our Forex Trading Foundation Masterclass, where we cover the essential concepts step-by-step before moving into advanced topics: Forex Foundations Masterclass.
While indicators can be useful, many experienced traders prefer to focus directly on price movement itself. This method is known as price action trading.
In this chapter, we will introduce the fundamentals of price action trading and explain how traders study price movements to understand market structure, liquidity, and trader psychology.
Types of Trading Approaches in the Market
In financial markets, traders generally analyze price using different approaches. These approaches can broadly be divided into three categories.
Indicator-Based Traders
Indicator-based traders rely heavily on technical indicators derived from historical price data.
Some commonly used indicators include:
- Moving Averages
- Relative Strength Index (RSI)
- MACD (Moving Average Convergence Divergence)
These indicators help traders identify potential trends, momentum shifts, and overbought or oversold conditions. However, because indicators are calculated from past data, they may sometimes respond slowly to sudden market changes.
Price Action Traders
Price action traders focus primarily on raw price movement on the chart.
Instead of relying on indicators, they observe how price behaves around important levels and patterns. Price action traders commonly study:
- Market structure
- Support and resistance levels
- Trend movements
- Chart patterns
- Candlestick formations
The main belief behind price action trading is that price reflects all available information in the market.
Traders Who Use Both Methods
Some traders combine both methods. They may analyze market structure using price action while also using indicators for additional confirmation.
This hybrid approach allows traders to gain multiple perspectives when interpreting market behavior.
What Is Price Action Trading?
Price action is the study of historical and current price movement to interpret market structure and possible future behavior.
This includes analyzing:
- Trends
- Support and resistance zones
- Breakouts
- Market consolidation
- Volatility and momentum
Why Price Action Trading Works
Price action analysis works because financial markets are influenced by supply and demand dynamics and trader psychology.
Several factors contribute to this:
Market Psychology
Human emotions such as fear, greed, and uncertainty often influence trading decisions. Because these behaviors repeat over time, markets tend to produce recurring price patterns.
Liquidity and Institutional Activity
Large financial institutions and banks operate with significant capital. Their activity often creates recognizable market structures and reaction levels.
Repeating Market Patterns
Markets frequently form recurring structures such as breakouts, reversals, and consolidations. Price action traders attempt to recognize these patterns to better understand potential market scenarios.
However, it is important to understand that no trading method guarantees outcomes. Price action trading helps traders interpret probabilities rather than predict markets with certainty.
How to Use Price Action Trading
Price action traders analyze historical charts and real-time market behavior to identify areas where the market may react.
Common situations traders look for include:
Breakout Points
A breakout occurs when price moves beyond a previously established support or resistance level.
Breakouts may indicate increasing market participation and momentum, although false breakouts are also common.
Trend Reversal Points
Trend reversals occur when the existing market direction begins to weaken and potentially change.
Price action traders look for signals such as:
- Loss of momentum
- Rejection at key price levels
- Failure to create new highs or lows
Trend Continuation Points
Markets rarely move in straight lines. During a trend, the market often retraces or consolidates before continuing in the same direction.
Price action traders observe these movements to understand whether the trend still has momentum.
Identifying Price Action Patterns
Another important aspect of price action trading is identifying patterns formed by price movements.
These patterns help traders understand how the market has behaved historically in similar situations.
Chart Patterns
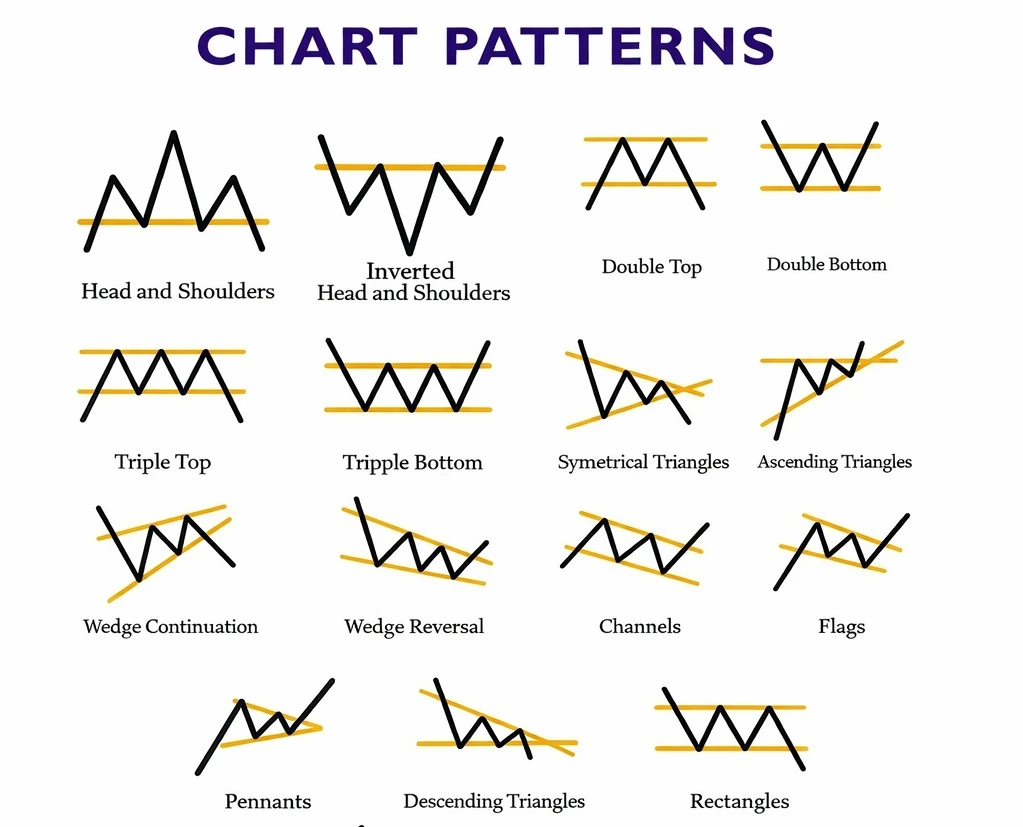
The image above shows several chart patterns that traders commonly study, such as:
- Head and Shoulders
- Inverted Head and Shoulders
- Double Top
- Double Bottom
- Triangles
- Wedges
- Flags
- Pennants
- Channels
- Rectangles
These chart patterns help traders identify potential trend reversals, trend continuations, or consolidation phases in the market.
In the next chapter, we will study these chart patterns in more detail and understand how traders interpret them within price action analysis.
Conclusion
Price action trading provides a structured way to analyze financial markets by focusing directly on price movement, market structure, and trader psychology.
By studying how price reacts around important levels and patterns, traders can gain a deeper understanding of market behavior. However, financial markets are inherently uncertain, and no strategy can guarantee profits.
Successful trading requires discipline, proper risk management, and realistic expectations.
This article is provided for educational purposes only and should not be considered financial advice. Traders should always evaluate their own risk tolerance and financial situation before participating in the forex market.
Recommended Learning Path for Beginners
If you are new to forex trading, it is important to learn the foundations step by step.
Our Forex Trading Foundation Masterclass provides a structured learning path covering:
- Forex market basics
- Technical indicators
- Price action trading
- Risk management principles
- Trading psychology
You can explore the complete beginner learning sequence here:Forex Foundations Masterclass.
Frequently Asked Questions
What is price action trading in forex?
Price action trading is a method of analyzing market behavior by studying raw price movements on a chart rather than relying heavily on technical indicators.
Why do traders use price action instead of indicators?
Some traders prefer price action because it allows them to observe market behavior directly without relying on calculations derived from past data.
Is price action trading suitable for beginners?
Yes, beginners can learn price action concepts because they focus on understanding basic market structure and chart behavior. However, beginners should also prioritize risk management.
Can price action trading predict the market?
No trading strategy can predict markets with certainty. Price action analysis helps traders interpret probabilities rather than guarantee outcomes.
What should beginners focus on when learning price action?
Beginners should focus on:
- Understanding market structure
- Learning support and resistance levels
- Practicing risk management
- Studying chart patterns gradually

Written by
Trade Together Research
Trade Together Research is a professional market analysis team providing forex, gold, and crypto trading insights, technical analysis, and educational guides.. Learn more about our research team on the About page.