AUDUSD 1-Hour Price Analysis — Order Block Reaction and Volume-Based Structural Zone in Focus: Wednesday, March 25, 2026
Wed Mar 25 2026
More analysis for this pair:
View all AUDUSD market analysis →Forex forecast for this pair:
View AUDUSD forecast →Market Context
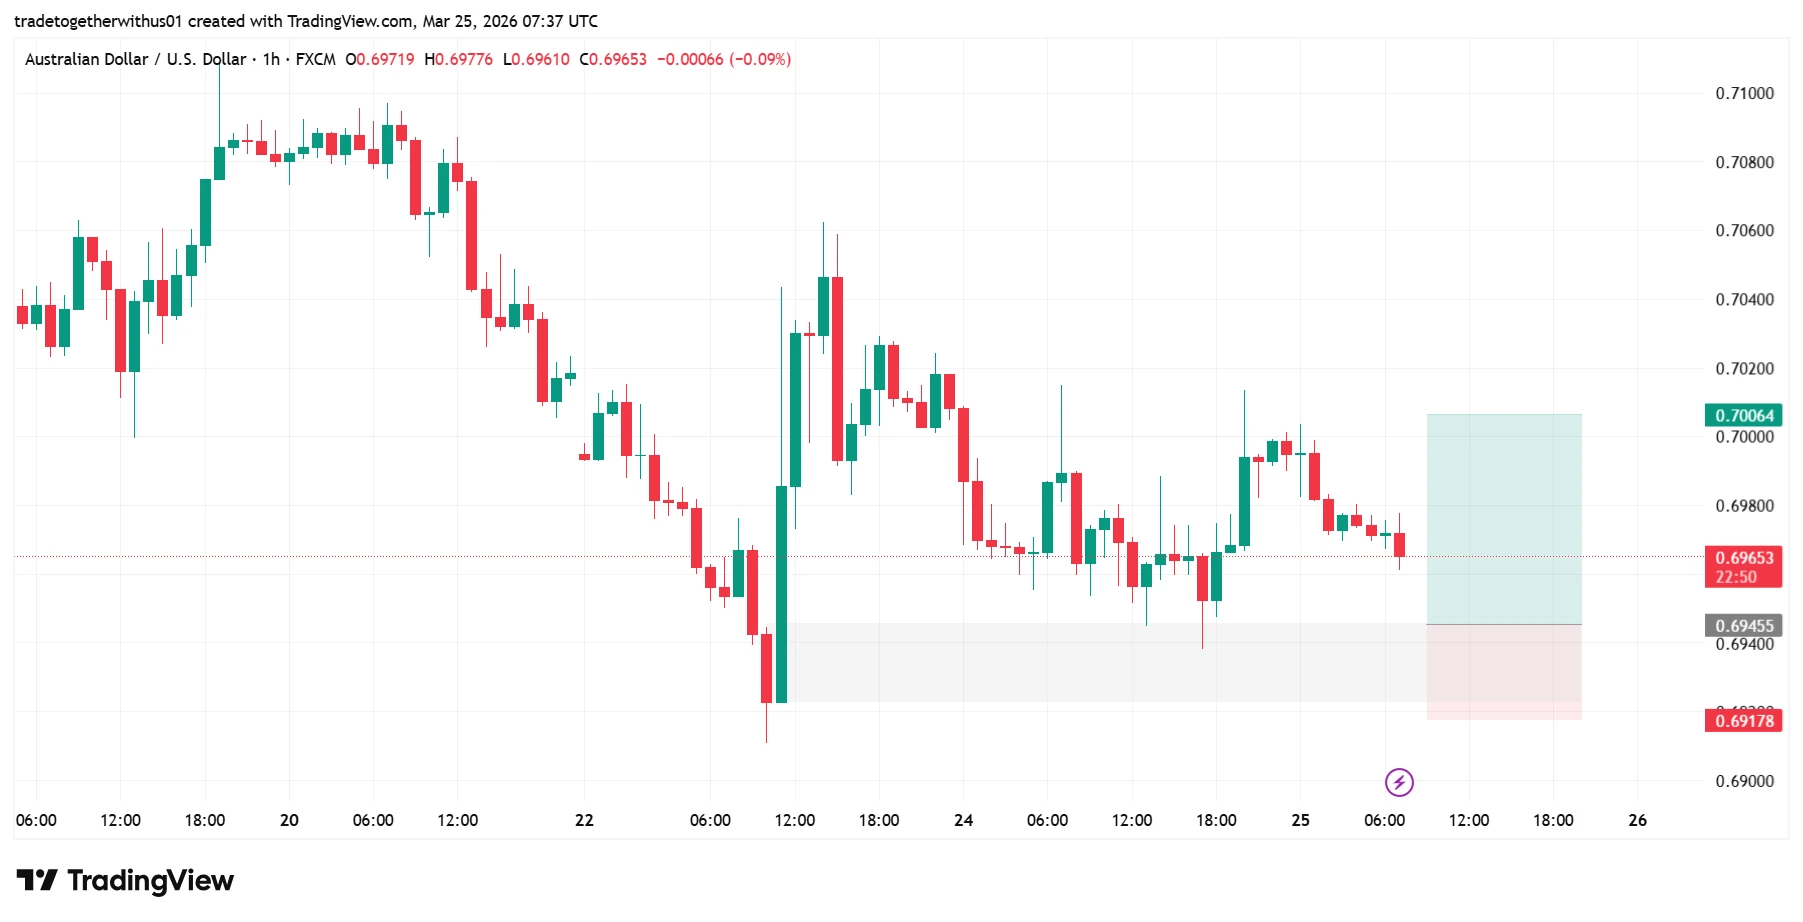
As of Wednesday, March 25, 2026, the AUD/USD currency pair on the 1-hour timeframe is interacting with a technically significant structural region that previously triggered a strong bullish displacement.
The highlighted chart zone represents an area where price structure, liquidity interaction, and volume concentration aligned, making it an important reference point for understanding how the market may behave in the near term.
To understand why this region matters, it is necessary to examine the prior trend environment, the structural shift that followed, and the volume dynamics inside the order block.
Higher Timeframe Structure: Downtrend Exhaustion
Before the formation of the highlighted reaction zone, AUD/USD had been moving within a clear bearish market structure, forming a sequence of lower highs and lower lows.
This pattern is the classic characteristic of a downtrend environment, where sellers maintain directional control over price movement. Understanding how these trend structures form is essential when analyzing market context, especially when identifying potential reversal zones.
A deeper explanation of how uptrends, downtrends, and sideways markets form can be found in this guide on market structure: Understanding Market Trends in Trading: Why Trend Analysis Matters -Chapter 9
Toward the end of this bearish sequence, price reached a region where the selling pressure began to weaken. This is where the chart shows the formation of a bullish order block, followed by a strong impulsive movement to the upside, leaving a visible imbalance in price movement.
Such displacement often indicates that new liquidity entered the market, interrupting the previous bearish flow.
Volume Concentration Inside the Order Block
To better understand the significance of this order block, the analysis focuses on volume distribution within the structure.
Using Fixed Range Volume analysis, the highest concentration of trading activity inside the order block was identified. This level represents the price point where the largest amount of trading occurred within that range.
In financial markets, areas with high volume often become important structural reference points, because they represent locations where large amounts of orders were previously executed.
Understanding how tick volume and trading activity reveal market participation is explained in detail in this guide:Chapter 13: Understanding Volume in Forex Trading: A Beginner Guide to Tick Volume and Market Activity
Volume indicators help traders identify where major market participation occurred, which can highlight areas of potential support, resistance, or structural reactions.
Defining the Structural Reaction Range
After identifying the highest-volume price level within the order block, a volatility-based boundary was calculated using Average True Range (ATR). This created a defined structural reaction range between:
- the highest volume node within the order block, and
- a lower boundary derived from ATR volatility measurements.
This range represents the portion of the chart where high participation and strong directional movement previously occurred, making it a key structural area when price revisits the region.
Markets frequently return to such zones to rebalance liquidity before establishing the next directional movement.
Price Reaction Within the Highlighted Zone
After the strong upward displacement, AUD/USD eventually retraced back toward the previously identified structural zone. When price revisited the area, several important observations appeared:
- Price entered the high-volume structural region.
- The market formed a short consolidation phase within the zone.
- A brief liquidity sweep occurred toward the lower boundary of the structure.
- Despite the sweep, no candle body closed below the structural boundary.
This type of behavior often suggests that the market recognized the zone as a significant area of liquidity interaction, where both buyers and sellers temporarily competed for control.
Lower Timeframe Momentum Shift
When examining the reaction more closely on a lower timeframe, the market structure showed signs of a short-term momentum shift.
The market formed a major change in character, followed by a break of structure, indicating that the immediate bearish momentum during the retracement had weakened.
Such structural confirmations help analysts understand whether a retracement into a key zone is simply a pullback or the beginning of a broader structural shift.
Understanding the Structural Zones on the Chart
The chart highlights three important structural areas that frame the market reaction.
Central Structural Reaction Zone
The middle region of the highlighted area corresponds to the highest volume concentration inside the order block, making it the primary structural reference point where market participation previously increased.
Lower Structural Boundary
The lower edge of the zone represents the volatility boundary derived from ATR calculations. This level marks the structural floor of the reaction zone where analysts observe whether the previous demand remains active.
Upper Liquidity Region
The upper highlighted area represents a region where price previously reacted after the initial bullish displacement. If momentum expands again, this region may become an area where liquidity and volatility increase.
Possible Market Scenarios
Financial markets can evolve in multiple directions depending on how price behaves around structural zones.
Scenario 1: Structural Continuation
If the market continues to respect the reaction zone and upward momentum strengthens, AUD/USD may gradually rotate toward the upper liquidity region highlighted on the chart.
Scenario 2: Structural Invalidation
If price moves decisively beyond the lower boundary of the structural zone, it may suggest that the earlier demand area is weakening, potentially allowing the broader bearish structure to reappear.
Scenario 3: Consolidation Development
Another possibility is that the market forms a temporary consolidation range within the highlighted zone while liquidity continues to rebalance.
What Market Participants May Watch Next
In the coming sessions, analysts may observe several key factors:
- Whether price continues to respect the structural reaction zone
- Formation of new structural highs or lows
- Momentum development following the liquidity sweep
- Volatility expansion near the upper region of the chart
Monitoring these structural elements helps build a clearer picture of how the market environment is evolving.
Learning Takeaway
This chart highlights an important principle in technical analysis:
Markets often revisit areas where strong participation previously occurred.
By combining trend analysis, volume concentration, and volatility measurements, analysts can identify zones where the market may react in the future.
Studying how price behaves around these areas provides valuable insights into market structure, liquidity, and trader positioning.
Explore more analysis from this trading session:
View all london Session Analysis →Explore more forex forecasts and market outlooks:
View Forex Forecast Hub →Forex forecast for this session:
View AUDUSD london Session Forecast →
Written by
Trade Together Research
Trade Together Research is a professional market analysis team providing forex, gold, and crypto trading insights, technical analysis, and educational guides.. Learn more about our research team on the About page.