Chapter 13: Understanding Volume in Forex Trading: A Beginner Guide to Tick Volume and Market Activity
Sun Mar 22 2026

1. Introduction to Volume in Forex Trading
In financial markets, volume refers to the level of activity or participation during a specific period. In simple terms, volume shows how actively traders are buying and selling in the market.
Many beginners focus mainly on price movements. However, experienced traders often analyze both price and market participation. Price shows what the market is doing, while volume helps explain how strong that movement might be.
When price moves with strong participation, the movement may be more meaningful. When price moves with weak participation, the movement may not be very strong.
Understanding this relationship can help traders interpret market behavior more clearly. Volume analysis does not guarantee outcomes, but it provides additional information that can help traders better understand market conditions.
In practical trading, volume is usually analyzed together with trend direction and key price levels. For example, traders often study trends and important price zones before looking at participation levels. If you want to understand how traders combine trend and price levels when analyzing a chart, you can read our guide on how to analyze a trade using trend and support–resistance step by step: https://tradetogether.in/articles/forex-trading-step-by-step-trend-support-resistance.
2. Why Volume Matters in Trading
Volume can help traders evaluate the strength behind price movements.
Confirming Market Trends
When a trend forms, traders often look for increasing volume in the direction of the trend.
For example:
- If price rises and volume also increases, it may suggest stronger buying participation.
- If price rises while volume decreases, the move may be weaker.
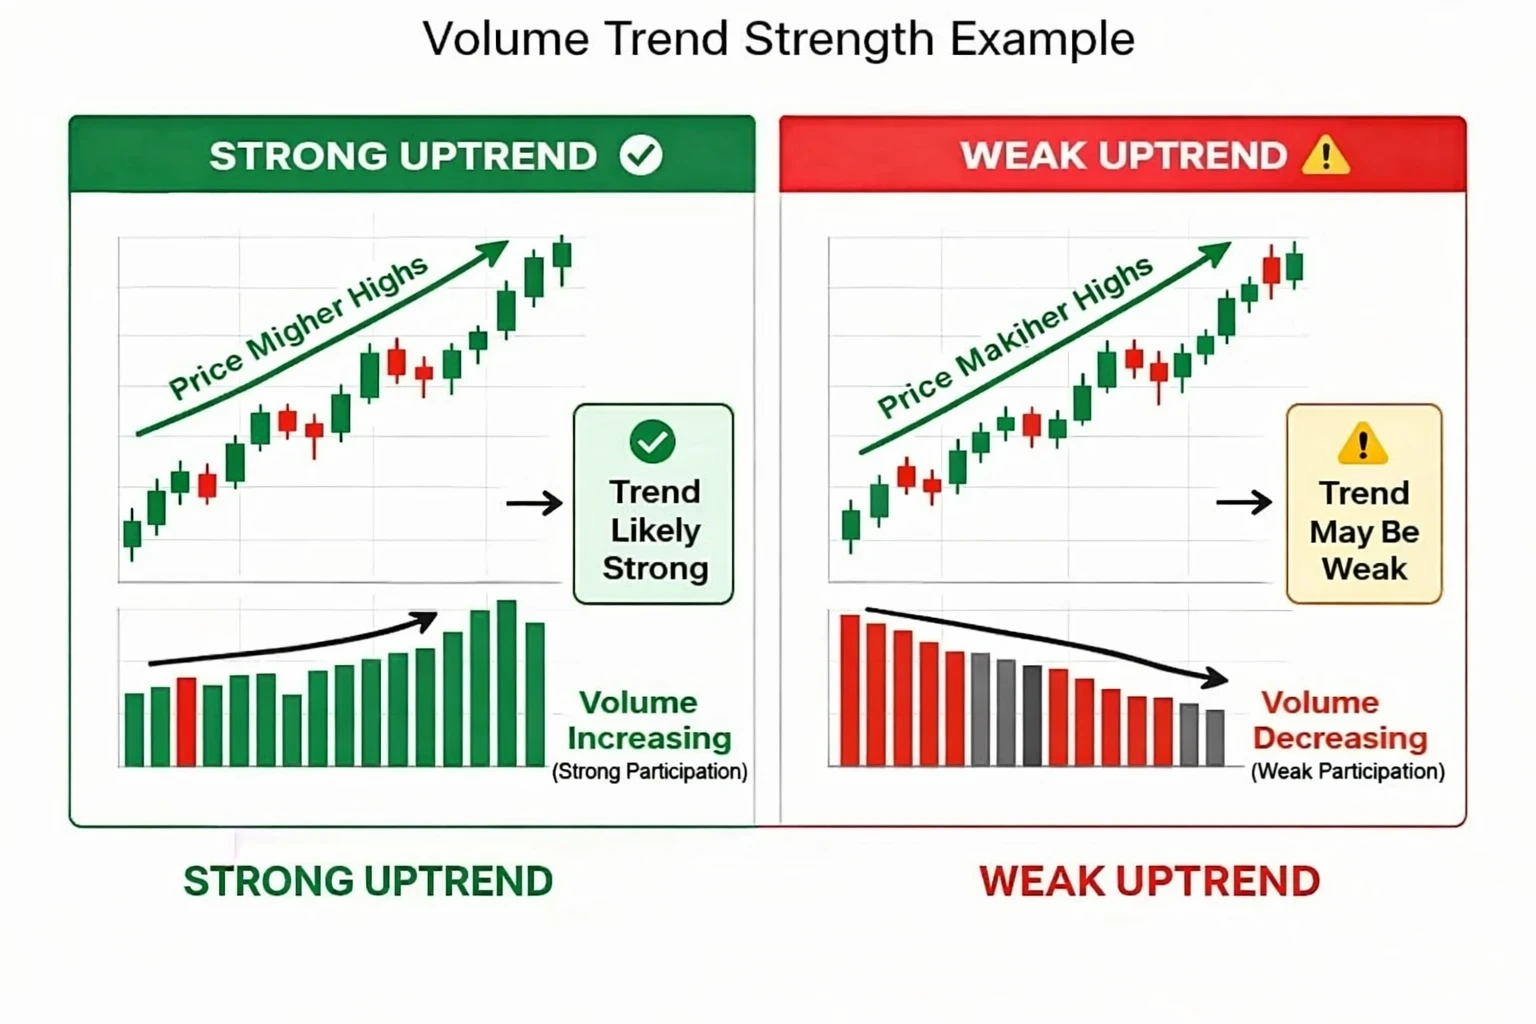
This does not guarantee that the trend will continue, but it provides additional context about market participation.
Identifying Strong vs Weak Price Moves
Sometimes price moves quickly in one direction, but the movement may not be supported by strong participation.
For example:
- A sharp price increase with low volume may indicate weak momentum.
- A steady move with increasing volume often suggests stronger participation.
This helps traders understand whether the market movement is strong or potentially temporary.
Understanding Market Participation
Volume also helps traders understand how active the market is during certain periods.
For example:
- The London trading session
- The New York trading session
- Major economic news events
During these periods, participation and volatility often increase.
Detecting Potential Breakouts
Volume can sometimes increase when price approaches important price levels.
For example:
- If price breaks above resistance with increasing volume, it may indicate stronger buying interest.
- If price breaks a level with low volume, the breakout may not sustain.
To understand how traders identify and analyze important price levels, you can read our beginner guide on support and resistance in forex trading: https://tradetogether.in/articles/support-and-resistance-forex-beginners-guide
3. How Volume Works in Different Financial Markets
Volume behaves differently depending on the type of market.
Volume in Stock Markets
In stock markets, volume represents the actual number of shares traded during a specific period. Stock exchanges record every transaction, so traders can see accurate trading volume.
Volume in Futures Markets
Futures markets also provide real trading volume because transactions occur on centralized exchanges.
Why Forex Volume Works Differently
The forex market operates differently from stocks and futures.
Forex trading is decentralized, meaning transactions occur across many banks, financial institutions, and trading platforms worldwide. Because there is no single central exchange, it is difficult to measure the total global trading volume in real time.
For this reason, forex trading platforms usually display tick volume.
4. Tick Volume in Forex Trading
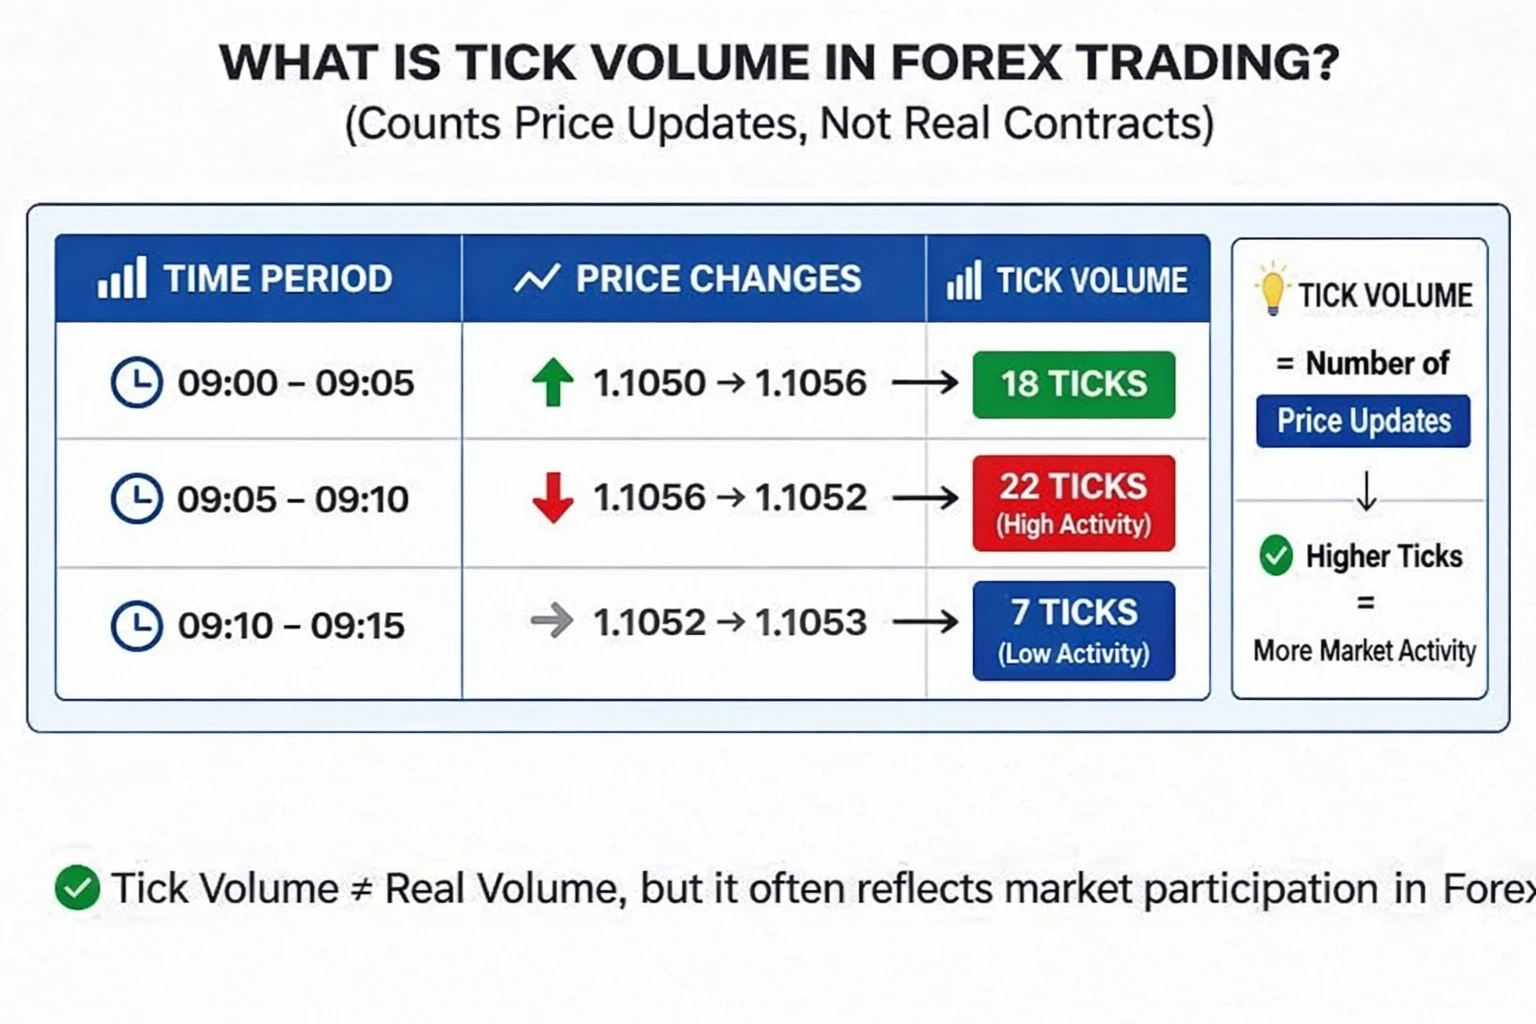
What Tick Volume Is
Tick volume measures how many times the price changes during a specific period.
For example:
- If price updates frequently during a candle, tick volume will be higher.
- If price barely moves, tick volume will be lower.
Although tick volume does not represent actual contracts traded, it often reflects the level of market activity.
How Tick Volume Is Calculated
Each time the price updates, the platform records a tick.
The number of ticks within a candle becomes the tick volume value.
For example:
If price updates 120 times during a five-minute candle, the tick volume for that candle will be 120.
Platforms That Display Volume
Most trading platforms display tick volume, including:
- TradingView
- MetaTrader 4
- MetaTrader 5
These platforms allow traders to observe how market participation changes throughout the day.
5. Uses of Volume in Market Analysis
Volume is often used as a supporting tool in technical analysis.
Confirming Trends and Patterns
Volume can help confirm patterns such as:
- Breakouts
- Trend continuation
- Reversal signals
If price movements occur with increasing participation, traders may interpret the move as stronger.
Identifying Strong Price Movements
When price moves strongly with rising volume, the movement may indicate stronger buying or selling pressure.
Conversely, price movement with declining volume may signal weaker momentum.
Measuring Market Activity
Volume also helps traders understand when markets are most active. Activity often increases during:
- Major trading sessions
- Economic data releases
- High-volatility events
Understanding Market Sentiment
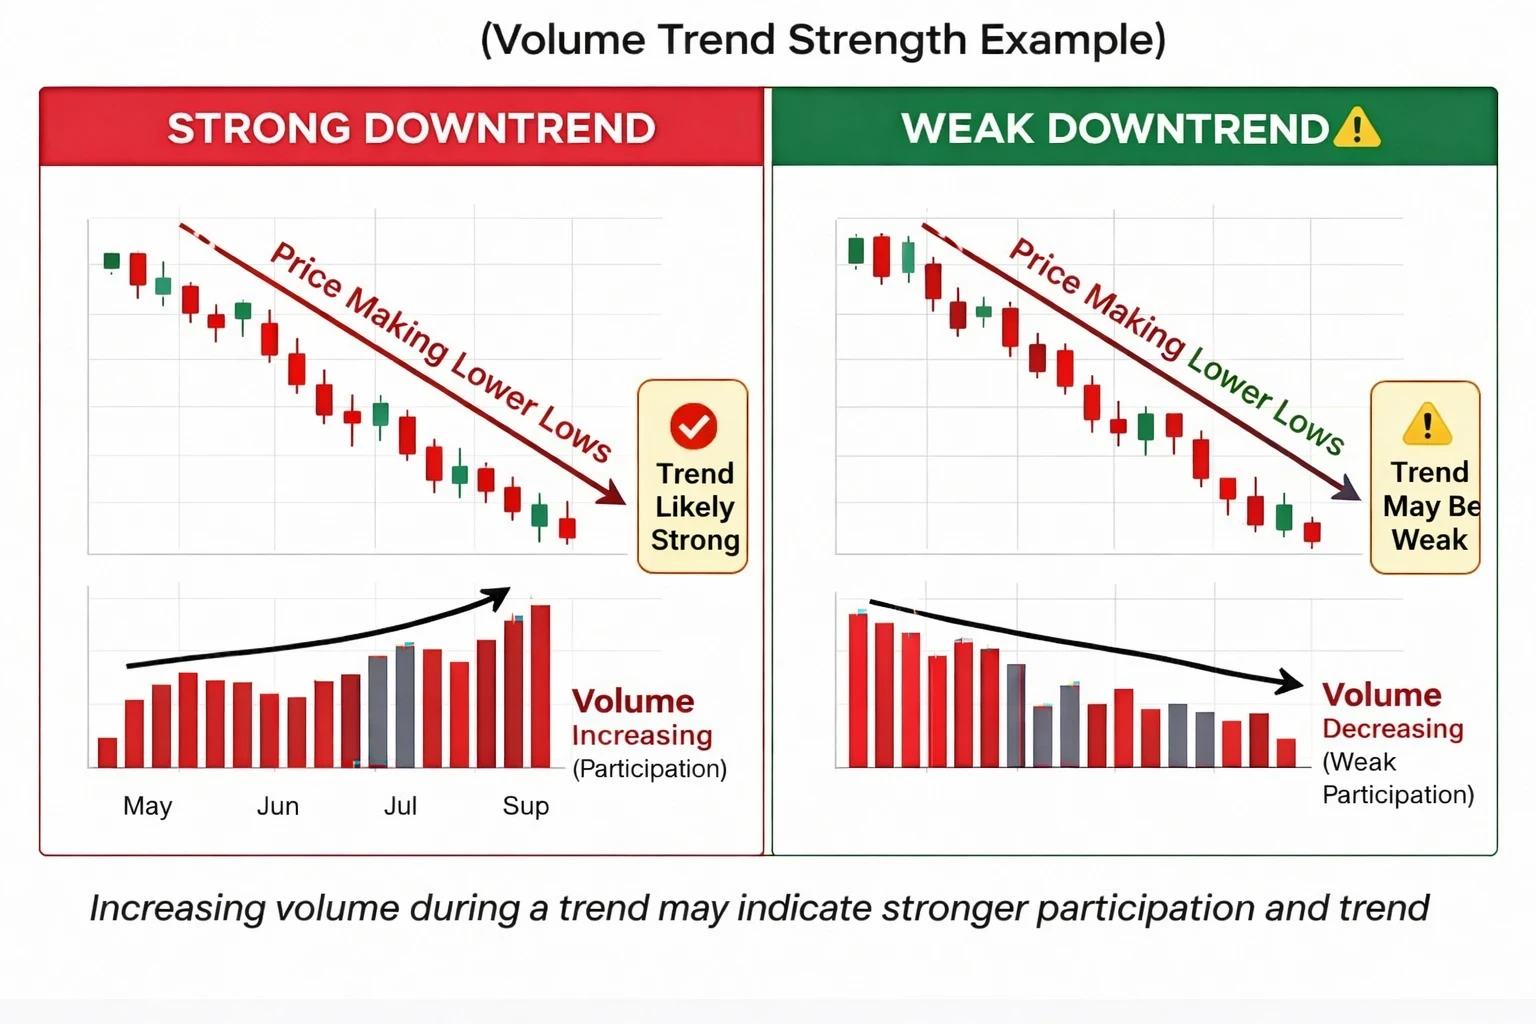
Volume can sometimes reflect market sentiment.
For example:
- Rising volume during a rally may suggest strong buying pressure.
- Rising volume during a decline may indicate strong selling pressure.
6. Understanding Volume Bars and Market Strength
Most charting platforms display volume as bars below the price chart.
Red and Green Volume Bars
Typically:
- Green bars represent stronger buying activity
- Red bars represent stronger selling activity
These colors simply help visualize market participation.
Buying vs Selling Pressure
Volume can provide clues about whether buyers or sellers dominate the market during a given period. However, volume should always be analyzed together with price action and market structure.
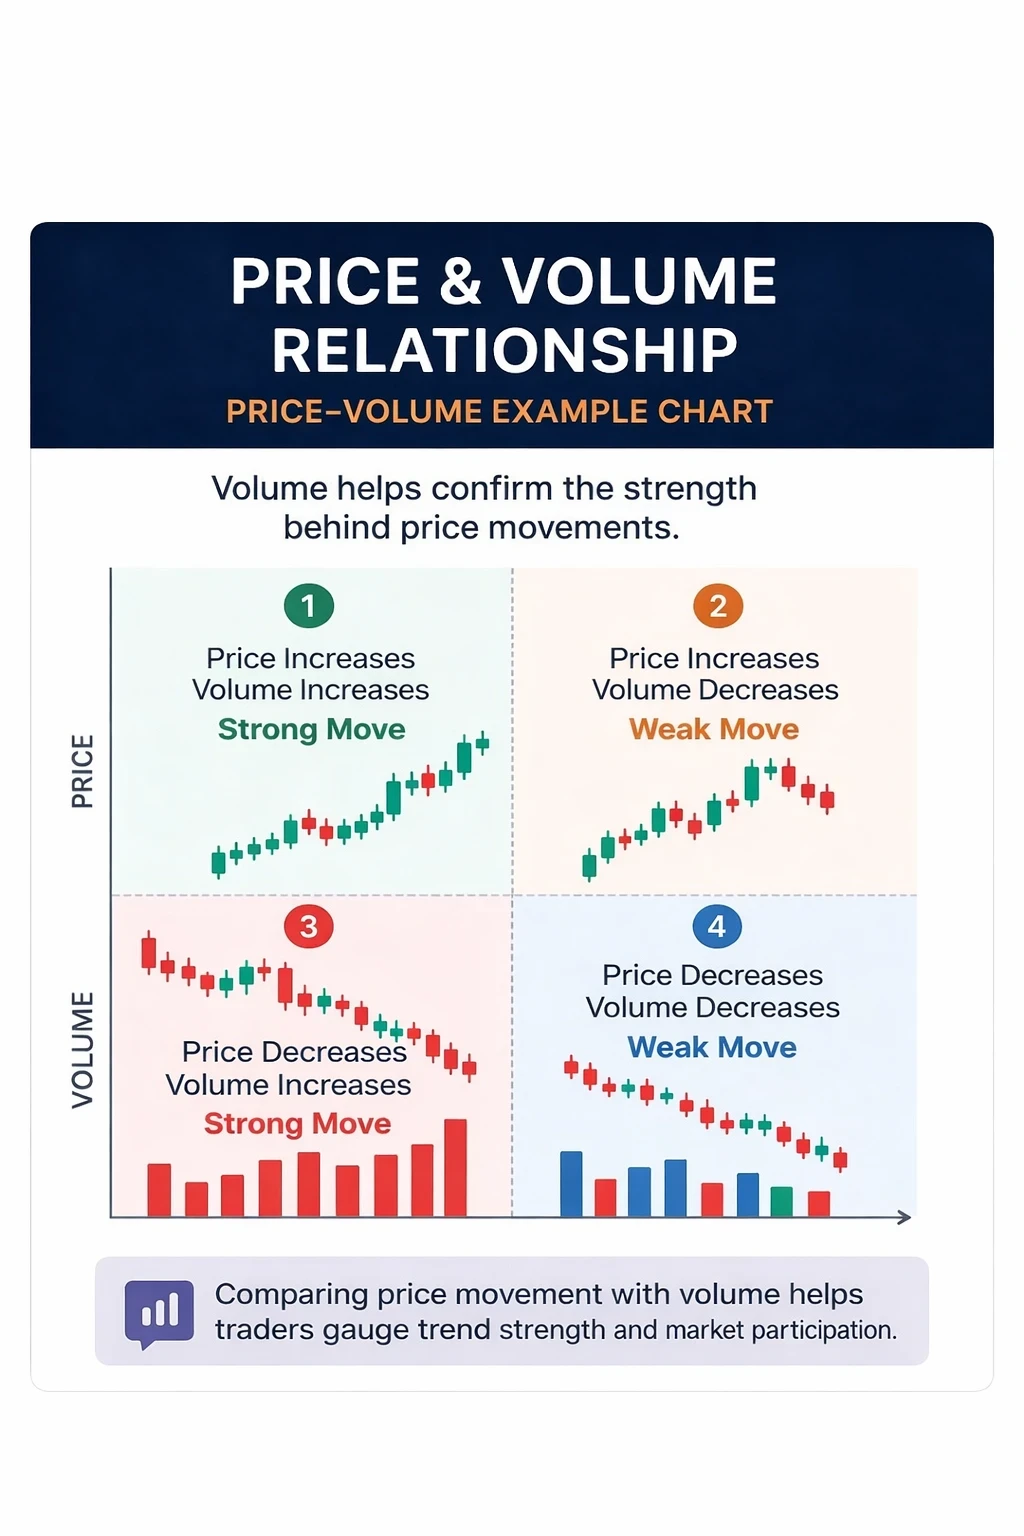
Price–Volume Relationship
| Price Movement | Volume Movement | Market Interpretation | ||
|---|---|---|---|---|
| Price Increases | Volume Increases | Strong buying pressure | ||
| Price Increases | Volume Decreases | Weak buying interest | ||
| Price Decreases | Volume Increases | Strong selling pressure | ||
| Price Decreases | Volume Decreases | Weak selling pressure |
This relationship helps traders interpret market strength.
7. Limitations of Volume in Forex
Although volume can provide useful insights, it also has limitations.
Tick Volume vs Real Volume
Forex platforms usually display tick volume rather than real transaction volume.
This means volume readings are estimates rather than exact measurements.
Differences Between Brokers
Different brokers may show slightly different tick volume values because each platform receives its own price feed.
Why Volume Should Not Be Used Alone
Volume works best when used alongside other analysis methods such as:
- Price action
- Trend analysis
- Support and resistance levels
- Risk management strategies
No single indicator can predict market movements with certainty.
8. Conclusion
Volume analysis helps traders understand how active the market is during price movements.
By observing the relationship between price and participation, traders may gain insights into:
- Market strength
- Potential momentum
- Participation levels
However, volume should always be interpreted carefully. Financial markets are influenced by many factors including liquidity, economic events, market sentiment, and trader psychology.
For this reason, traders often combine volume analysis with price action, trend analysis, and disciplined risk management rather than relying on a single tool.
FAQ
Is volume reliable in forex trading?
Forex platforms usually display tick volume rather than actual trading volume. While not exact, it can still provide insights into market activity.
What is tick volume in forex?
Tick volume measures the number of times price changes during a specific time period.
Why is forex volume different from stock market volume?
The forex market is decentralized and operates across many financial institutions, unlike stock exchanges that record every trade.
Can volume predict price movements?
Volume cannot predict price movements with certainty. It is best used as additional information when analyzing price behavior.

Written by
Trade Together Research
Trade Together Research is a professional market analysis team providing forex, gold, and crypto trading insights, technical analysis, and educational guides.. Learn more about our research team on the About page.