Understanding Market Trends in Trading: Why Trend Analysis Matters -Chapter 9
Sun Mar 15 2026
Introduction: Why Traders Study Market Direction
In the previous chapters of this course, we learned the foundations of forex trading and how price behaves in financial markets.
For example, in Chapter 8 – Part 1, we studied the basics of candlestick charts and how to read bullish and bearish candles. You can review that concept here: https://tradetogether.in/articles/how-to-read-candlestick-charts-beginners-bullish-bearish
In Chapter 8 – Part 2, we explored different candlestick types such as Marubozu, Doji, Spinning Top, Paper Umbrella, and Shooting Star and their applications in market analysis: https://tradetogether.in/articles/candlestick-types-explained-marubozu-doji-spinning-top
These concepts help traders understand individual price movements.
However, understanding single candles alone is not enough. Traders also need to understand the overall direction of the market, which is known as the trend.
Professional traders, institutions, and banks rarely analyze the market without considering the broader trend. Trends reflect the collective behavior of buyers and sellers, influenced by macroeconomic conditions, liquidity flows, and market psychology.
In this chapter, we will learn what a trend is, why it is important, and how traders identify trends in financial markets.
What Is a Trend in Financial Markets?
A trend refers to the general direction in which the market moves over a period of time.
Price rarely moves in a perfectly straight line. Instead, it moves in waves — rising, falling, and pausing. When these movements collectively show a directional bias, traders describe it as a trend.
In simple terms, a trend answers one important question:
Is the market generally moving upward, downward, or sideways?
Understanding this direction helps traders interpret market behavior more effectively. Trends develop due to several factors, including:
- Global economic conditions
- Central bank policies and interest rates
- Institutional investment flows
- Market sentiment and trader psychology
Because forex markets operate globally and continuously, these factors interact to produce identifiable price trends.
Why Trend Is Very Important in Trading
Many beginners focus heavily on indicators or individual candlestick patterns while overlooking the broader trend. However, experienced traders often consider trend analysis as one of the most important aspects of market analysis.
The reason is simple: trends reflect the dominant market direction created by collective buying or selling activity.
Trading in alignment with the trend may help traders understand market momentum more clearly, while trading against the trend often involves higher uncertainty.
For example:
- If the market has been rising for several sessions, this suggests sustained buying pressure.
- If the market has been declining consistently, this reflects stronger selling pressure.
This does not guarantee future price movement, but it helps traders understand market probability and behavior.
Trend analysis also helps traders manage risk more effectively.
Understanding the dominant direction can prevent traders from entering positions during uncertain or low-probability market conditions.
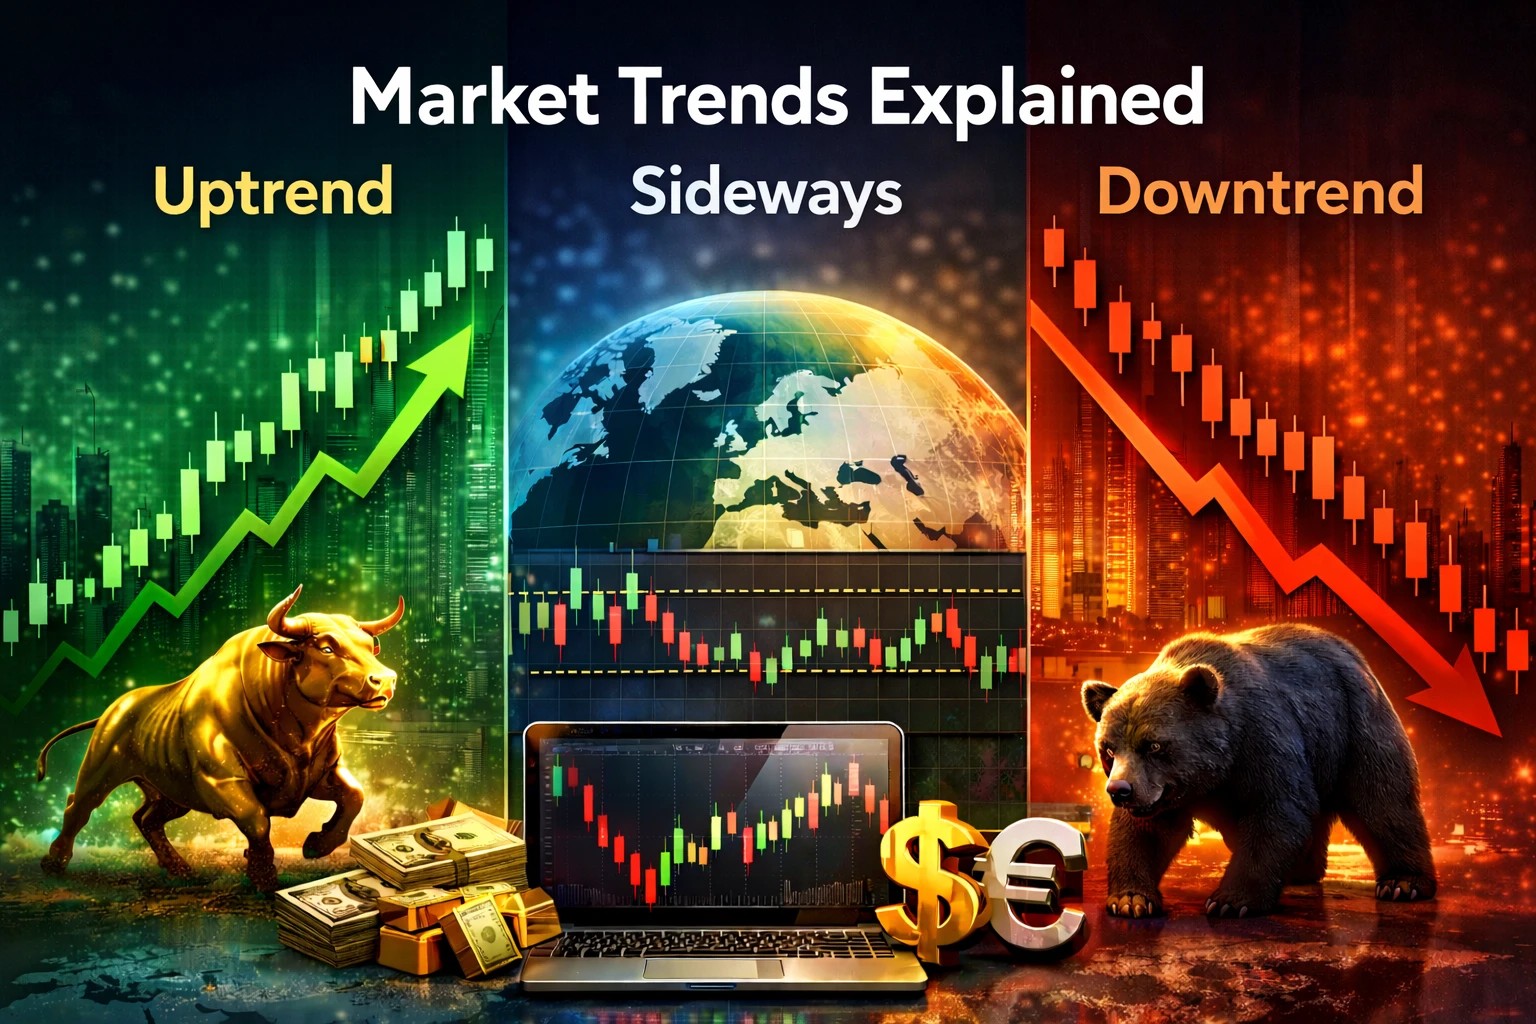
The Three Main Types of Trends
Financial markets generally move in three types of trends.
1. Uptrend
An uptrend occurs when prices consistently form higher highs and higher lows. This means:
- Buyers are willing to purchase at increasingly higher prices
- Market sentiment is generally optimistic
- Buying pressure dominates the market
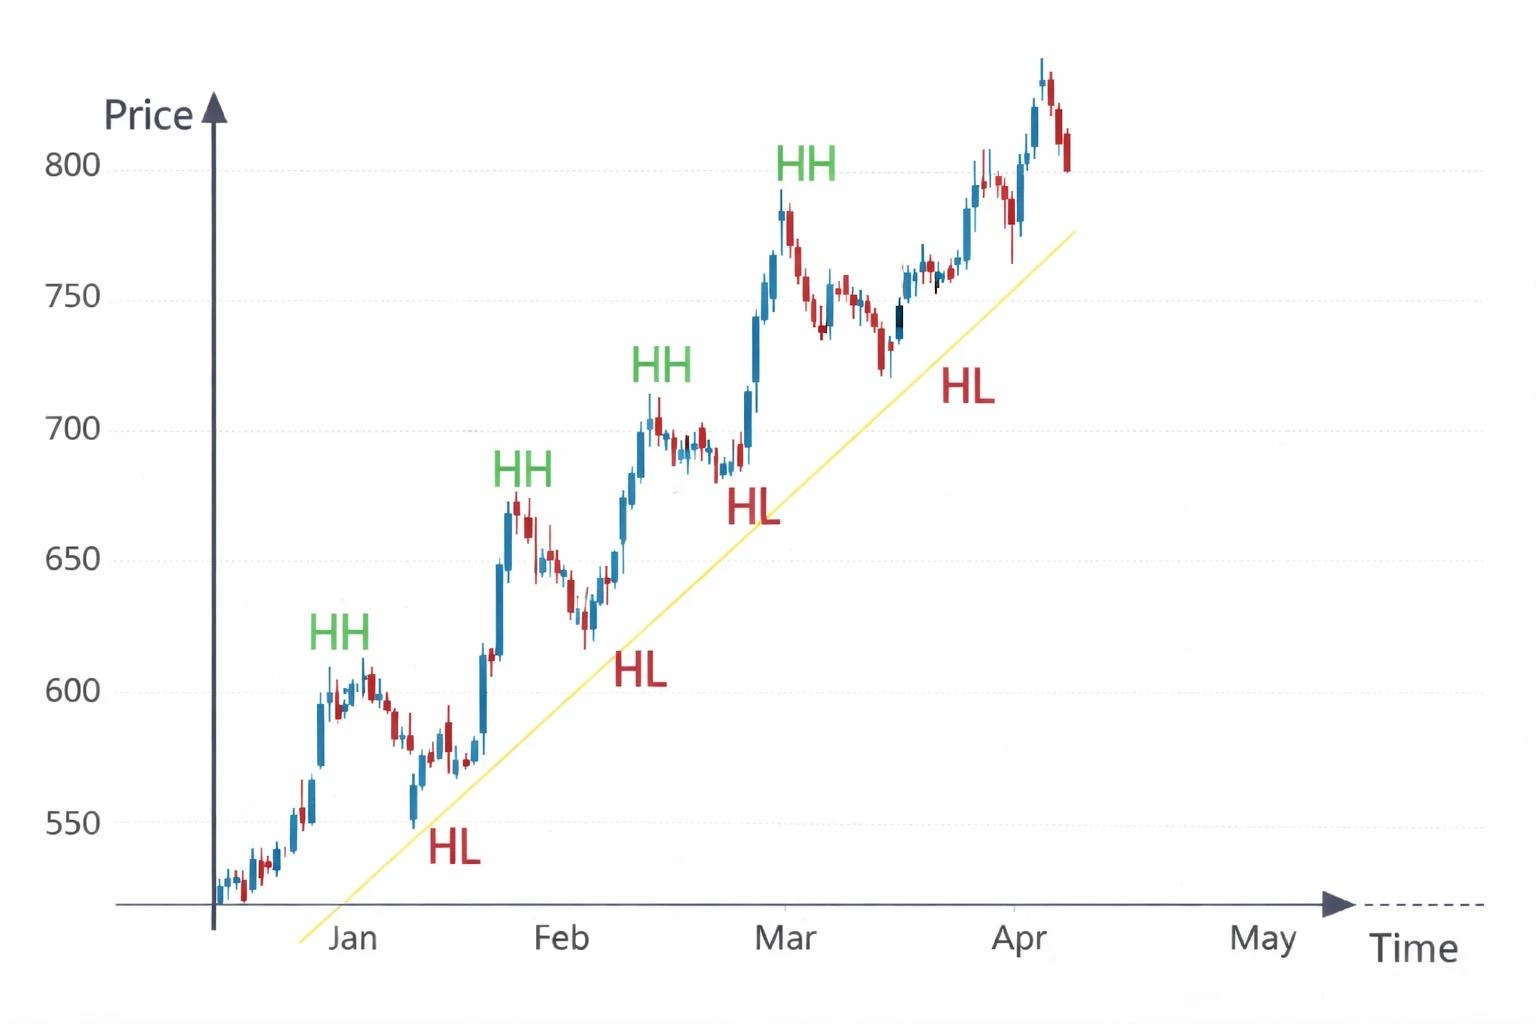
In an uptrend, the market gradually moves upward even though small pullbacks may occur.
2. Downtrend
A downtrend occurs when prices consistently form lower highs and lower lows. This indicates:
- Sellers dominate the market
- Market sentiment becomes more cautious or negative
- Selling pressure exceeds buying pressure
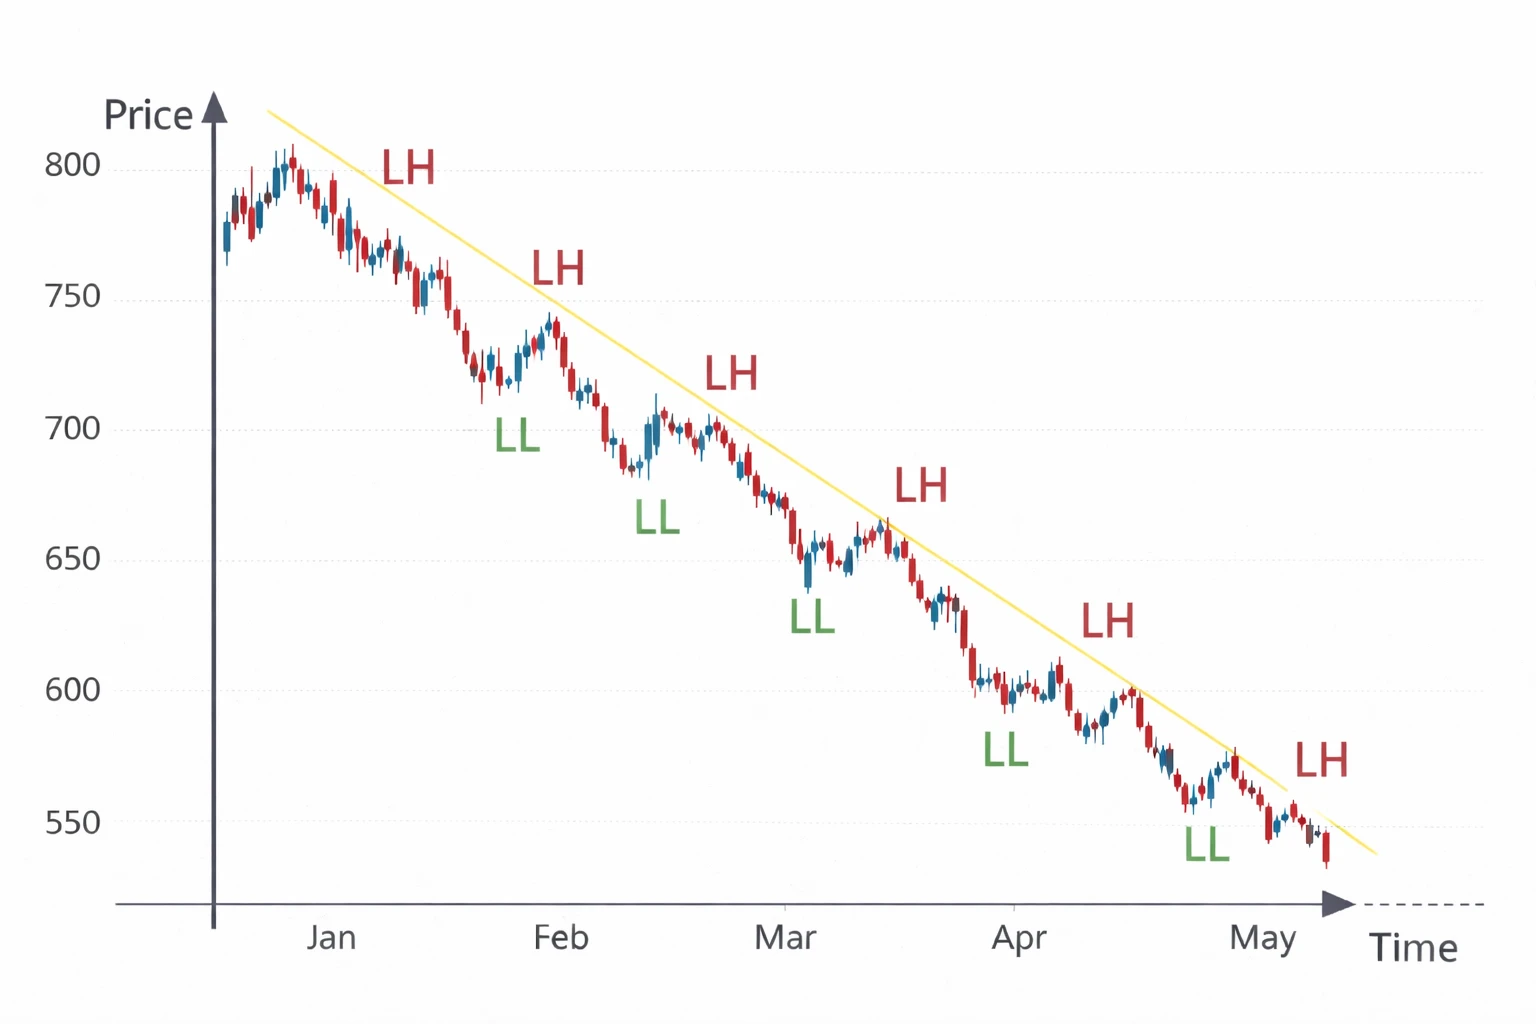
In a downtrend, price gradually moves lower as selling momentum increases.
3. Sideways Trend (Range)
Sometimes markets do not move clearly upward or downward. Instead, prices fluctuate within a horizontal range.
This is known as a sideways trend or consolidation phase.
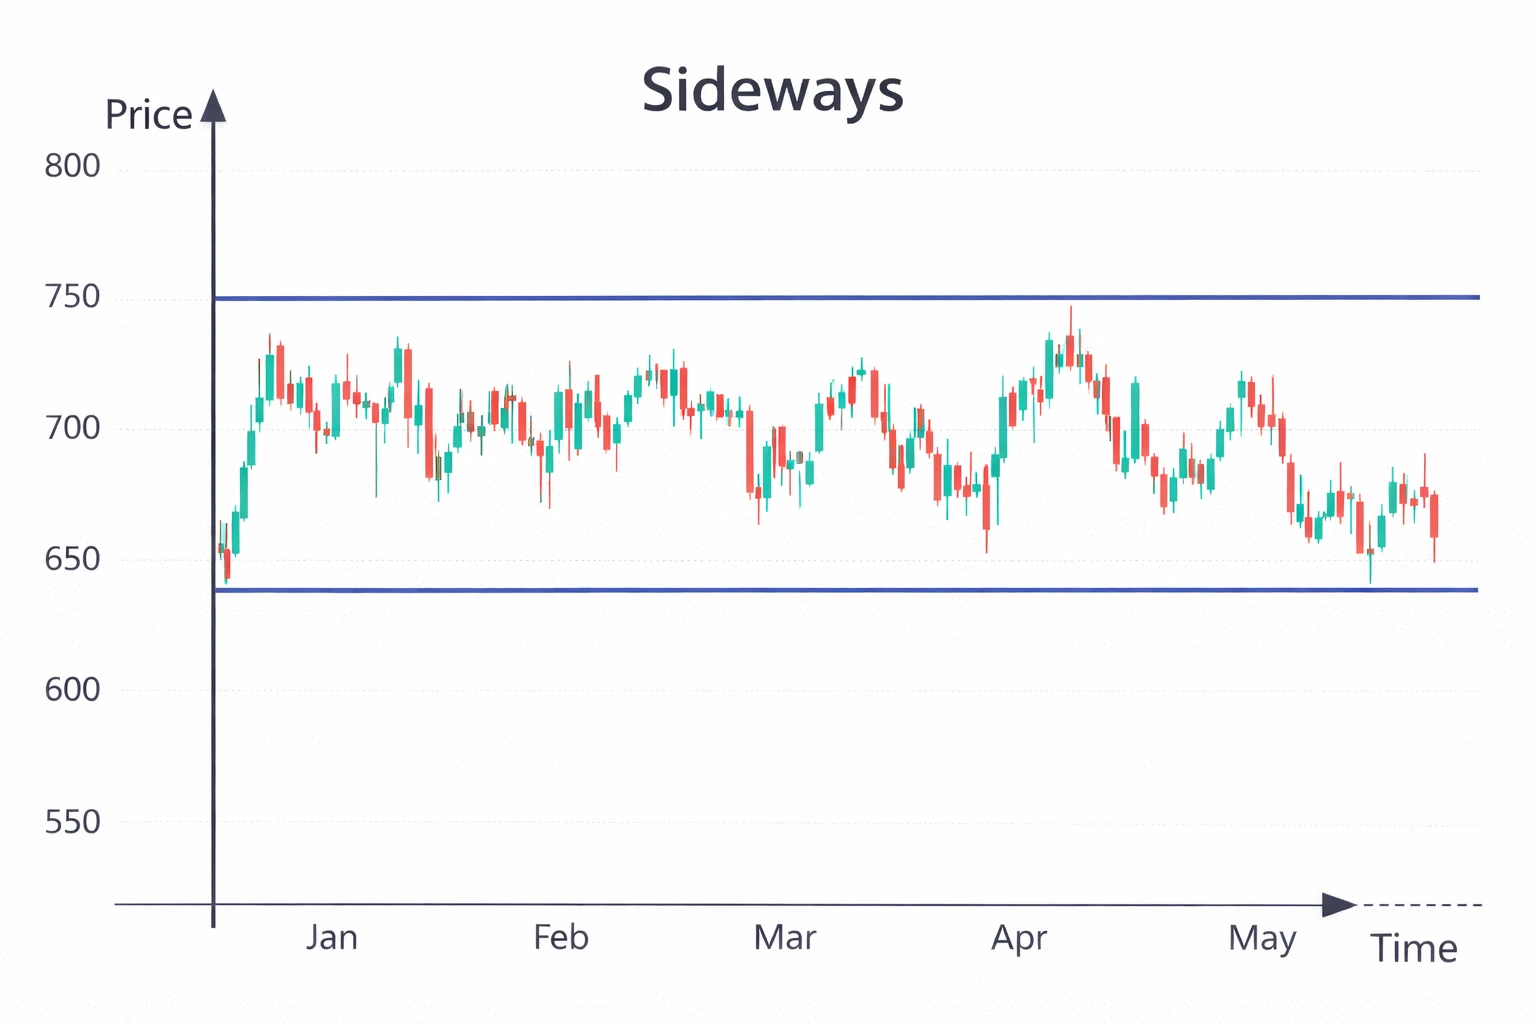
During this period:
- Buyers and sellers are relatively balanced
- The market often waits for new economic information
- Price moves between support and resistance levels
Sideways conditions often appear before major economic announcements or changes in market sentiment.
Tools Commonly Used for Trend Analysis
While trends can sometimes be observed directly from price movement, traders often use additional tools to analyze trends more clearly.
Some commonly used tools include:
- Trendlines
- Moving averages
- Support and resistance levels
Trendlines help visualize directional movement, while moving averages smooth price data to reveal underlying trends.
Support and resistance levels help identify areas where price has historically reacted.
These tools help traders interpret market structure more effectively.
In the upcoming chapters, we will study these tools in much greater detail, including how traders use them to analyze trends and market behavior.
What Traders Should Learn from Trend Analysis
Trend analysis is not about predicting the future with certainty. Instead, it helps traders understand market probability and behavior. By understanding trends, traders can:
- Recognize the dominant market direction
- Understand the balance between buyers and sellers
- Identify periods of strong momentum or consolidation
However, professional trading always involves risk management.
Even when trends appear strong, traders often manage risk using:
- Proper position sizing
- Stop-loss protection
- Diversified risk management strategies
If you are new to trading, it is also useful to understand the basics of entering the market and managing trading accounts. You can review that topic in Chapter 3 here:
Frequently Asked Questions
What is the easiest way to identify a trend?
Many traders identify trends by observing higher highs and higher lows for an uptrend or lower highs and lower lows for a downtrend.
Can trends suddenly change direction?
Yes. Trends can change due to economic news, central bank policy changes, or shifts in market sentiment.
Is trend analysis used only in forex trading?
No. Trend analysis is widely used in forex, stock markets, commodities, and cryptocurrency markets.
Why do beginners ignore trends?
Some beginners focus mainly on indicators or single candles without considering the broader market direction. Trend analysis helps provide important context.
Conclusion
Trends play a central role in understanding financial markets.
By analyzing trends, traders gain insight into market direction, momentum, and sentiment. This helps place individual price movements into a broader context.
However, trends are only one part of market analysis. Successful trading also involves risk management, market structure understanding, and awareness of global economic factors.
In upcoming chapters, we will explore tools such as trendlines, moving averages, and support and resistance, which help traders analyze trends more effectively.

Written by
Trade Together Research
Trade Together Research is a professional market analysis team providing forex, gold, and crypto trading insights, technical analysis, and educational guides.. Learn more about our research team on the About page.