BTCUSD Bitcoin Price Analysis – Tuesday, March 17, 2026: Rejection at Key $75.7K–$76.6K Resistance Signals Potential Structure Shift
Tue Mar 17 2026
More analysis for this pair:
View all BTCUSD market analysis →Forex forecast for this pair:
View BTCUSD forecast →Market Context
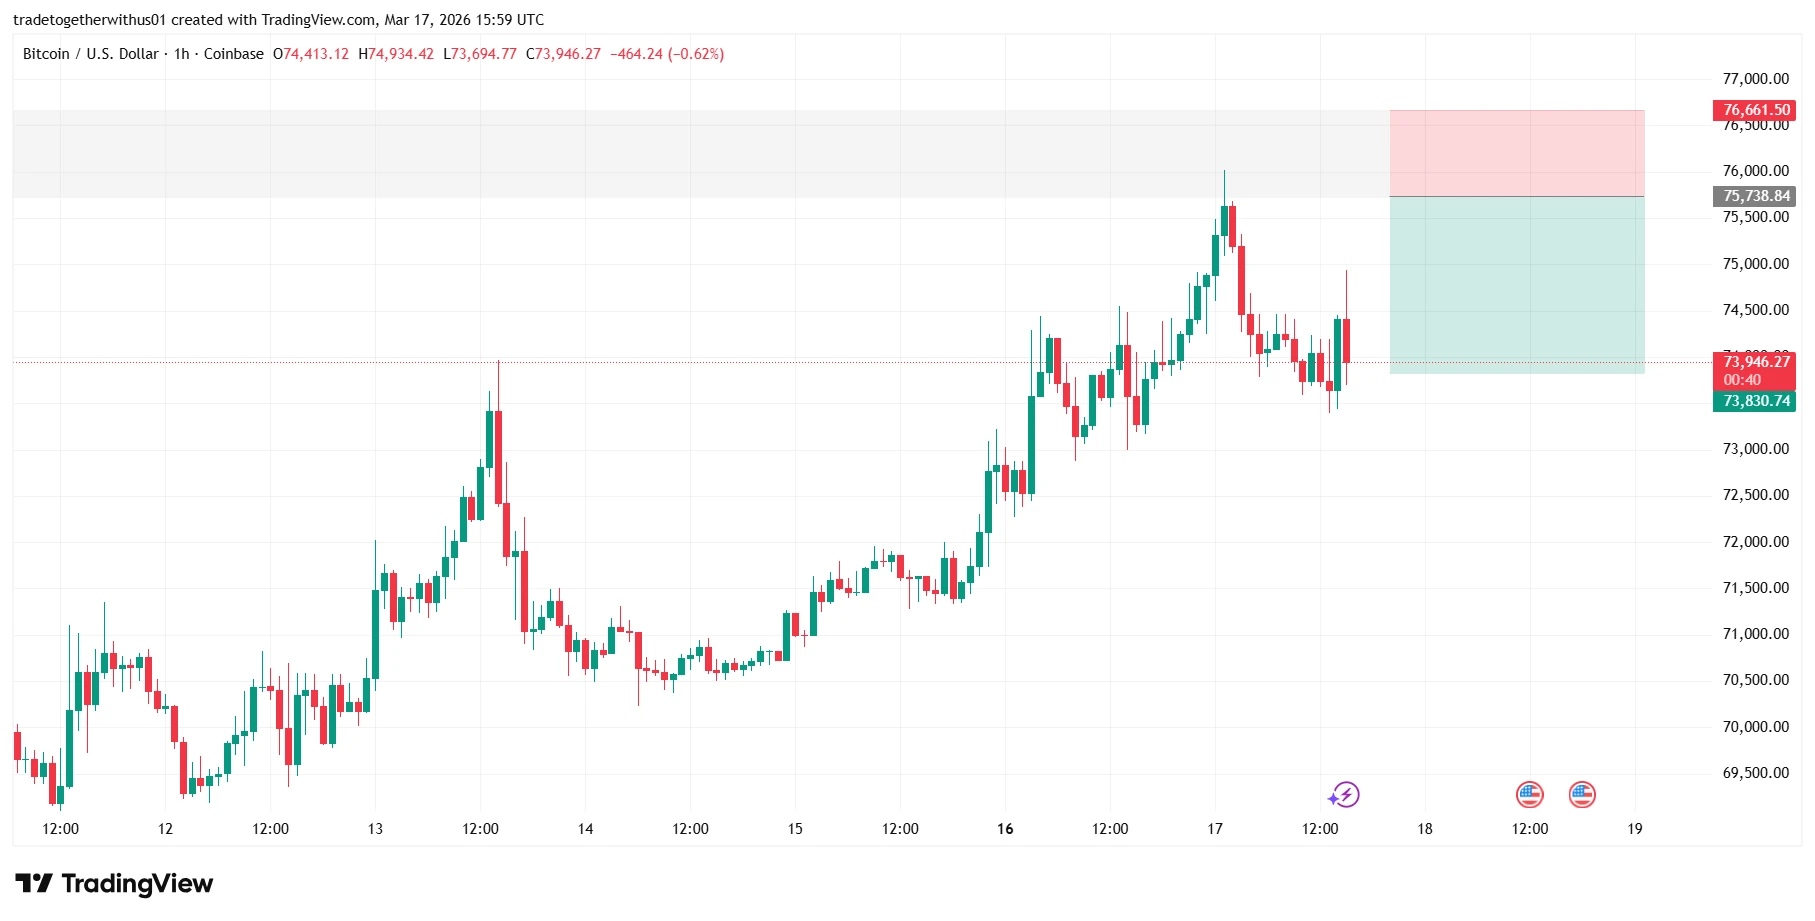
Bitcoin continues to trade within a technically significant region after approaching a historically respected resistance zone between $75,737 and $76,684. Price behavior near this area has drawn attention due to repeated reactions in the past, highlighting it as a key structural level where supply and demand dynamics have previously shifted.
As Bitcoin approached this zone again, the market displayed several technical signals that indicated a potential change in short-term momentum. Observing how price behaves around such historically respected levels can provide valuable insight into broader market structure and sentiment.
Higher Timeframe Structure
From a broader perspective, Bitcoin had been forming a short-term upward move leading into the resistance region. The gradual climb toward the zone suggested buyers were maintaining control during the advance.
However, this upward movement ultimately led directly into a region that had already acted multiple times as both support and resistance in previous price action. Such zones often attract increased market attention because they represent areas where liquidity and order flow tend to concentrate.
Understanding how these levels function is a fundamental concept in technical analysis. For readers unfamiliar with this idea, a deeper explanation can be found in this guide on support and resistance in Forex trading: https://tradetogether.in/articles/support-and-resistance-forex-beginners-guide
When price revisits such historically respected areas, traders typically monitor them closely for signs of rejection, continuation, or consolidation.
Current Chart Structure and Key Observations
On the 1-hour timeframe, Bitcoin’s upward move into the resistance region produced a clear reaction from sellers.
A notable development occurred when a rejection candle in the form of a shooting star appeared near the upper boundary of the resistance zone. This pattern is commonly associated with rejection at higher prices, especially when it forms at the top of an upward movement.
The candlestick displayed a long upper wick and a relatively small body, indicating that although price briefly pushed higher, selling pressure eventually drove the market back down before the candle closed.
For readers seeking a deeper understanding of how these formations work, our educational article on candlestick types in trading explains how traders interpret patterns like the shooting star in technical analysis: https://tradetogether.in/articles/candlestick-types-explained-marubozu-doji-spinning-top
Following the rejection candle, the market produced a confirmation candle showing continued downward pressure, suggesting that the resistance zone remained effective in limiting upward progress.
Momentum Shift and Lower Timeframe Structure
After the rejection occurred on the 1-hour chart, the 15-minute timeframe revealed a shift in market structure.
The sequence began with a Change of Character (ChoCH) toward the downside, indicating that the previous bullish momentum was weakening. Shortly afterward, price action produced a Break of Structure (BoS) below a recent swing point.
This sequence is often interpreted as a technical signal that the short-term trend structure may be transitioning from bullish to bearish.
Momentum shifts of this nature frequently occur when price reacts strongly to established resistance zones.
Educational Breakdown of the Marked Structural Zones
The chart highlights three important structural areas that illustrate how technical levels can be used to study market behavior.
Resistance Zone
The region between $75,737 and $76,684 represents a historically respected resistance band. Multiple previous reactions in this area suggest that it has repeatedly acted as a supply zone.
When Bitcoin returned to this region, the appearance of a rejection candlestick reinforced its technical significance.
Risk Zone (Upper Boundary)
The upper highlighted region represents the structural invalidation area, located above the resistance zone. If price were to move decisively beyond this area, it could indicate that sellers are losing control of the level.
Lower Structural Area
The lower highlighted region represents another key structural zone on the chart, where price previously interacted with market liquidity. Areas such as this often attract attention because they can become regions where price slows, consolidates, or reacts depending on overall market momentum.
Rather than acting as predetermined outcomes, these highlighted zones serve as reference points for understanding how price interacts with historical market structure.
Alternative Market Scenarios
Because financial markets are dynamic, multiple outcomes remain possible.
Continuation Scenario
If selling pressure continues to build following the rejection, Bitcoin could revisit lower structural levels where previous support has emerged. In such a scenario, the recent break in short-term structure may guide the direction of momentum.
Invalidation Scenario
Should price regain strength and move above the resistance band, the recent rejection may prove temporary. A sustained move above this zone could indicate renewed bullish momentum.
Consolidation Scenario
Another possibility is sideways movement within the current range. Markets often pause near major structural levels as participants reassess direction.
What Market Participants Should Watch Next
Going forward, attention will likely remain focused on how Bitcoin behaves relative to the $75.7K–$76.6K resistance zone and the recently formed lower-timeframe structure.
Key observations include:
- Whether price continues respecting the resistance area
- How the market reacts near lower structural zones
- Whether further structure breaks occur on intraday timeframes
- The development of consolidation patterns around current levels
Monitoring these elements can help provide clues about whether the recent momentum shift develops into a broader directional move.
Learning Takeaway
This chart provides a strong example of how multiple technical concepts can align around a single price region:
- Historically respected support and resistance zones
- Candlestick rejection patterns
- Momentum shifts through structure changes
- Lower timeframe confirmation of market sentiment
By observing how these elements interact, traders can develop a more structured approach to reading price behavior rather than relying on isolated indicators.
Explore more analysis from this trading session:
View all newyork Session Analysis →Explore more forex forecasts and market outlooks:
View Forex Forecast Hub →Forex forecast for this session:
View BTCUSD newyork Session Forecast →
Written by
Trade Together Research
Trade Together Research is a professional market analysis team providing forex, gold, and crypto trading insights, technical analysis, and educational guides.. Learn more about our research team on the About page.