Chapter 19: Fibonacci Retracement Levels in Forex Trading Explained for Beginners
Tue Apr 07 2026
Introduction
In the previous chapter, we discussed how traders use indicators like the Stochastic Oscillator and RSI to understand market momentum and potential turning points. You can read previous chapter from here Chapter 18: Stochastic Oscillator and RSI Indicators in Forex Trading Explained.
However, markets rarely move in a straight line. Price often moves in waves, making temporary pullbacks before continuing the trend. One of the most widely used tools to analyze these pullbacks is the Fibonacci Retracement tool.
Part 1: Understanding the Fibonacci Sequence
Before learning Fibonacci retracement in trading, it is important to understand where these numbers come from.
The Fibonacci sequence is a mathematical pattern discovered by the Italian mathematician Leonardo Fibonacci in the 12th century. In this sequence, each number is the sum of the two numbers before it.
Example sequence:
0, 1, 1, 2, 3, 5, 8, 13, 21, 34, 55, 89...
From this sequence, several important ratios are derived that appear frequently in nature and financial markets.
Some examples include:
- 55 ÷ 89 ≈ 0.618
- 34 ÷ 89 ≈ 0.382
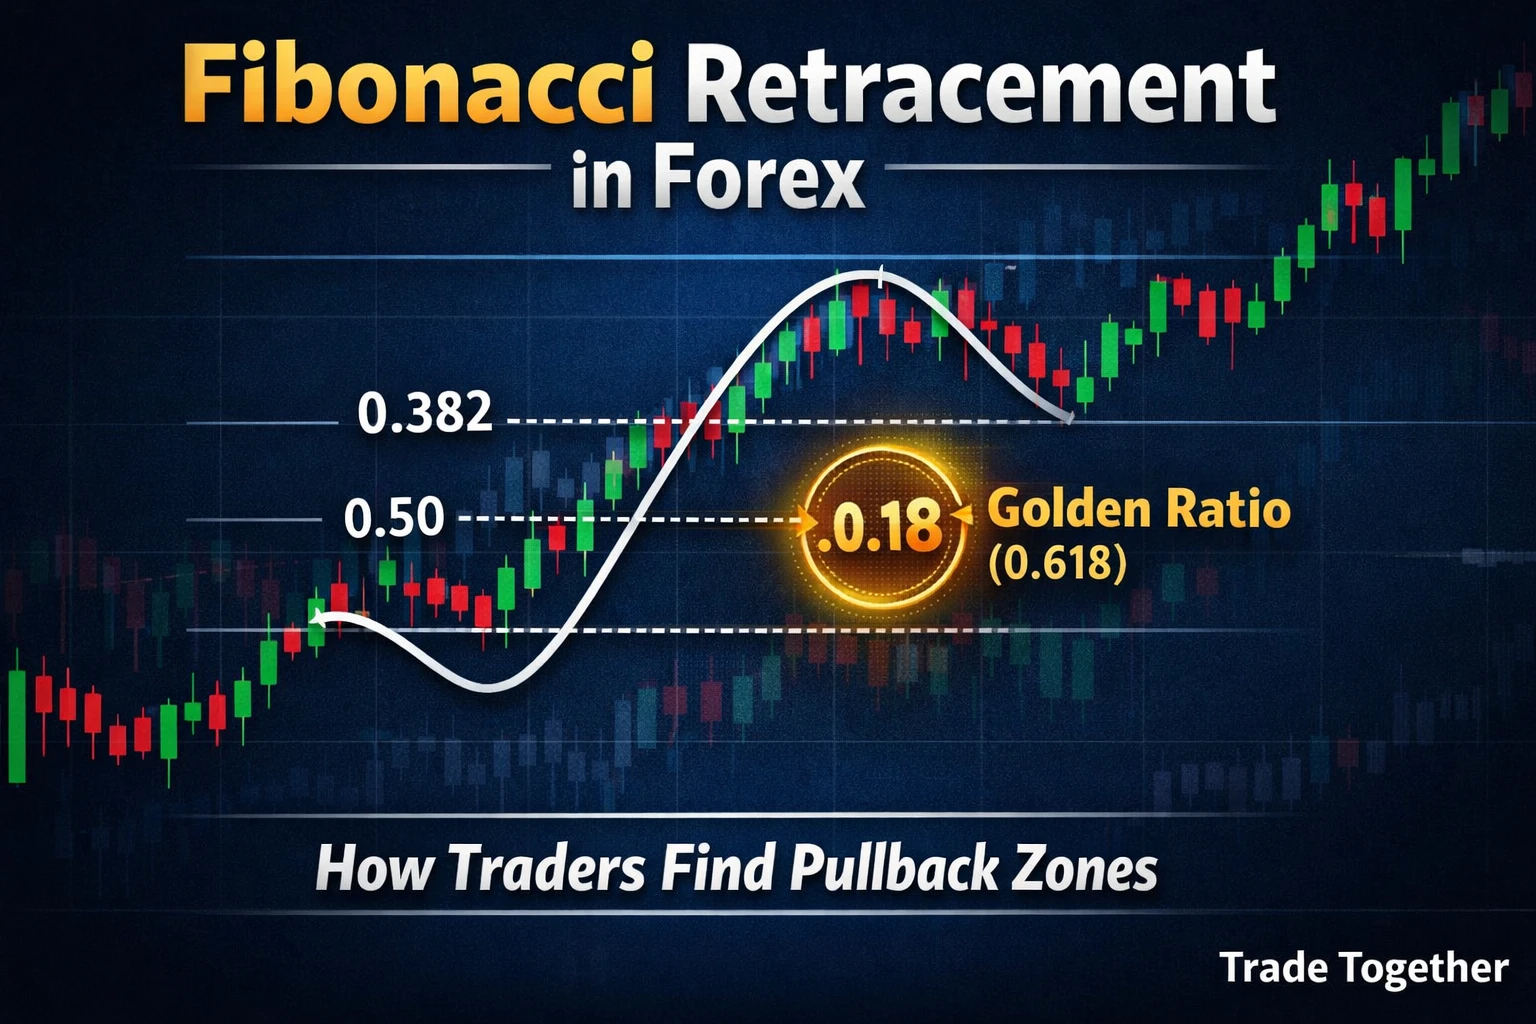
One of the most important ratios derived from the Fibonacci sequence is 0.618, which is commonly known as the Golden Ratio.
The inverse of this ratio is:
1 ÷ 0.618 = 1.618
The number 1.618 is also referred to as the Golden Ratio, and it appears in many natural patterns such as plant growth, biological proportions, and geometric structures.
Because financial markets are driven by human behavior, crowd psychology, and repeating patterns, traders often observe similar proportional relationships in price movements.
This is why Fibonacci ratios became widely used in technical analysis and trading.
Why Fibonacci Works in Trading
Fibonacci retracement levels do not predict the market with certainty. Instead, they work because many traders and institutions monitor these levels.
Financial markets are influenced by several factors such as:
- Market structure
- Liquidity
- Trader psychology
- Institutional order flow
When a strong trend occurs, traders who missed the initial move often wait for a pullback to enter the market.
Fibonacci levels help traders identify possible areas where price may temporarily pause or reverse during a retracement.
Because large numbers of traders watch these levels, they sometimes act as temporary support or resistance zones.
However, Fibonacci retracement should not be used alone. Professional traders usually combine it with:
- Support and resistance
- Market structure
- Liquidity zones
- Trend direction
- Risk management
Important Fibonacci Levels Traders Watch
While several Fibonacci ratios exist, traders typically focus on a few key retracement levels.
0.382 (38.2%)
This is considered a shallow retracement level. In strong trends, the market may only retrace to this level before continuing the trend.
0.5 (50%)
Although 50% is not technically part of the Fibonacci sequence, it is widely used in trading. Markets often retrace about half of the previous move before continuing.
0.618 (61.8%)
This level is known as the Golden Ratio and is one of the most important Fibonacci levels in financial markets.
Many traders closely watch this level because price reactions frequently occur here.
0.764 (76.4%)
This represents a deeper retracement level. If price reaches this area, traders often analyze the market carefully because deeper retracements can indicate weakening momentum.
It is important to remember that Fibonacci levels should be treated as zones of interest rather than exact price points.
Practical Example: Understanding Fibonacci Retracement
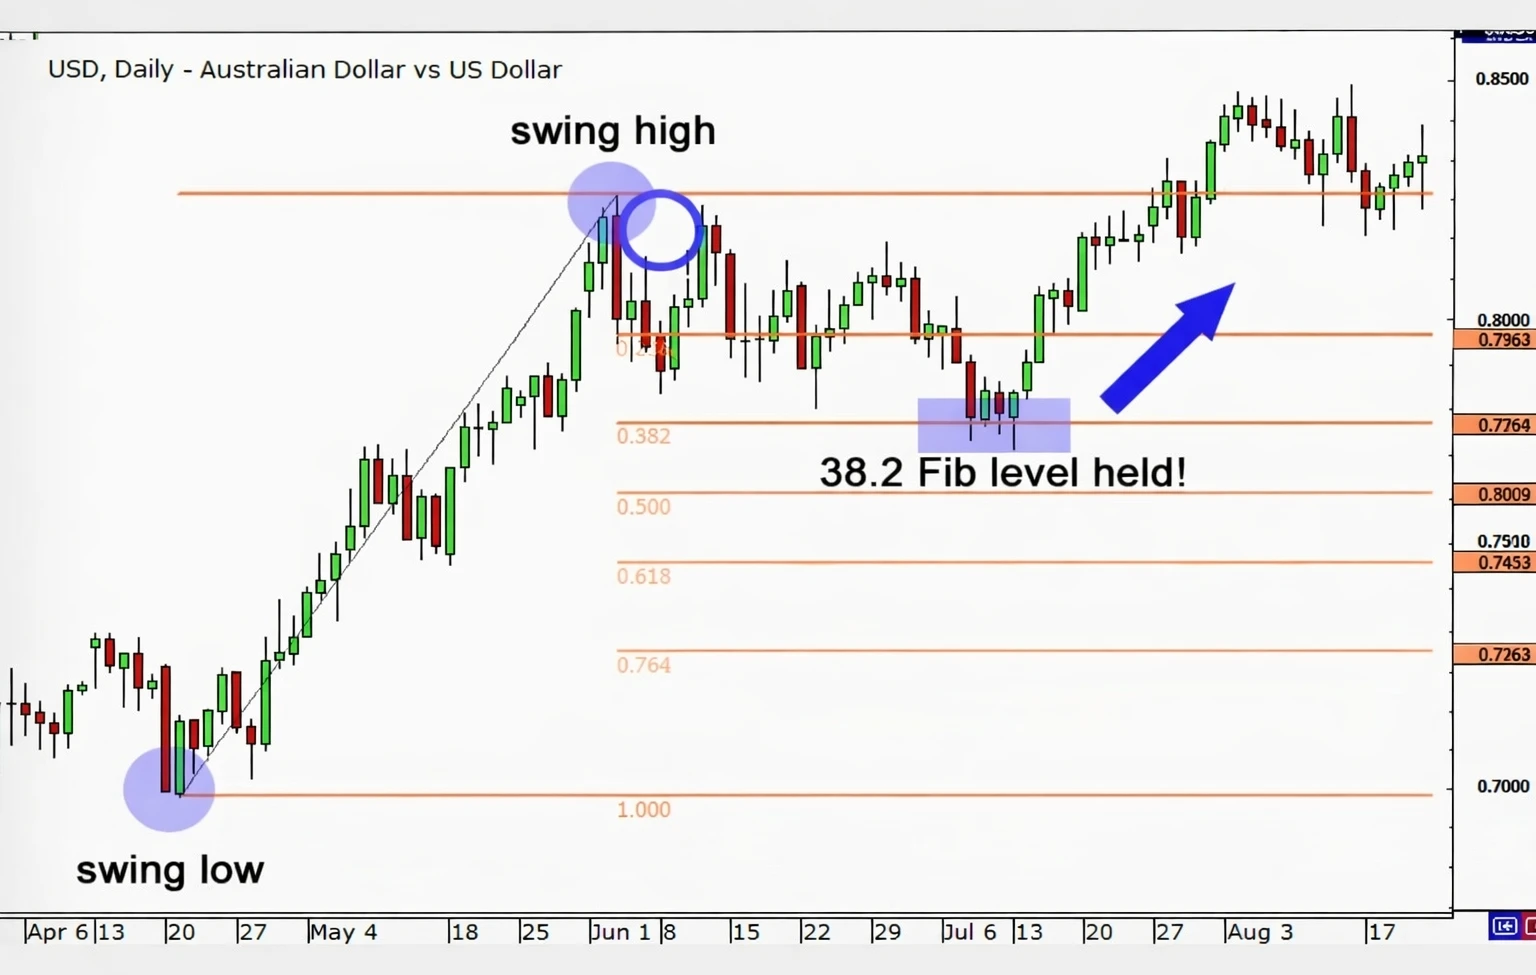
As you can see in the image, the market first moved upward from a swing low to a swing high.
After this movement, price started to pull back. When the Fibonacci retracement tool was applied from the swing low to the swing high, several retracement levels appeared on the chart.
During this pullback, price moved down and tested the 0.382 (38.2%) Fibonacci level.
As you can see in the image, the market found support near this level and then started moving upward again. This shows how Fibonacci levels can sometimes act as support during a pullback in an uptrend.
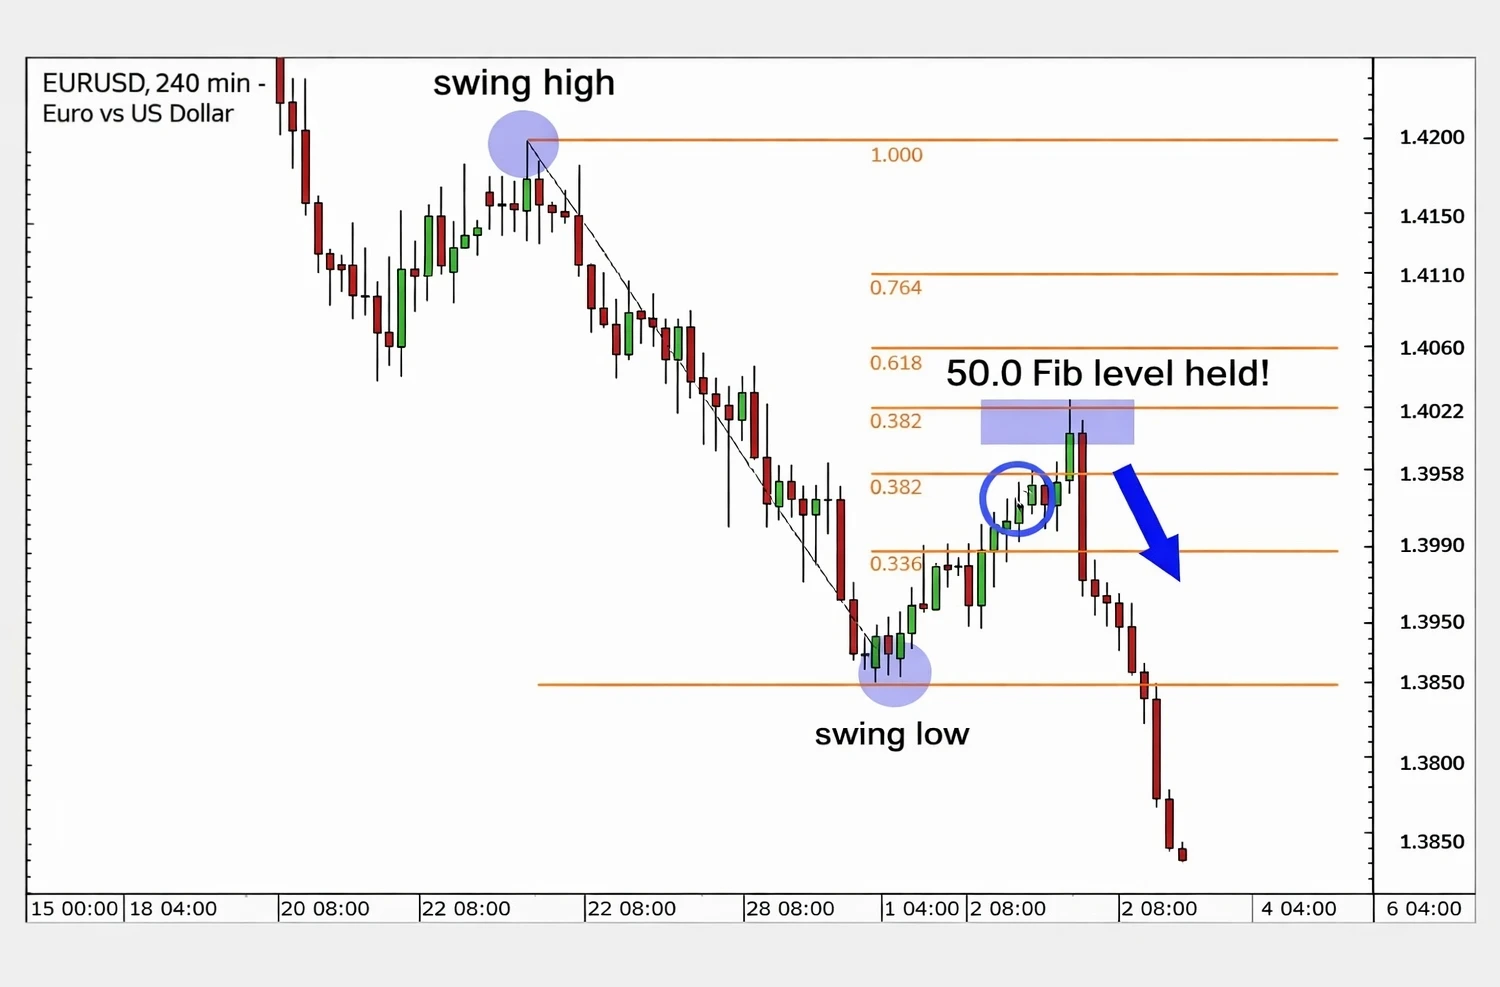
In the second example, the market first moved downward from a swing high to a swing low.
After this movement, the market began retracing upward. When the Fibonacci tool was applied from the swing high to the swing low, retracement levels appeared on the chart.
As you can see in the image, price retraced upward and approached the 0.5 (50%) Fibonacci level.
Around this level, the market slowed down and eventually continued the downward trend.
This example shows how Fibonacci levels can sometimes act as resistance zones during a pullback in a downtrend.
Part 2: Live Market Example (XAUUSD Chart)
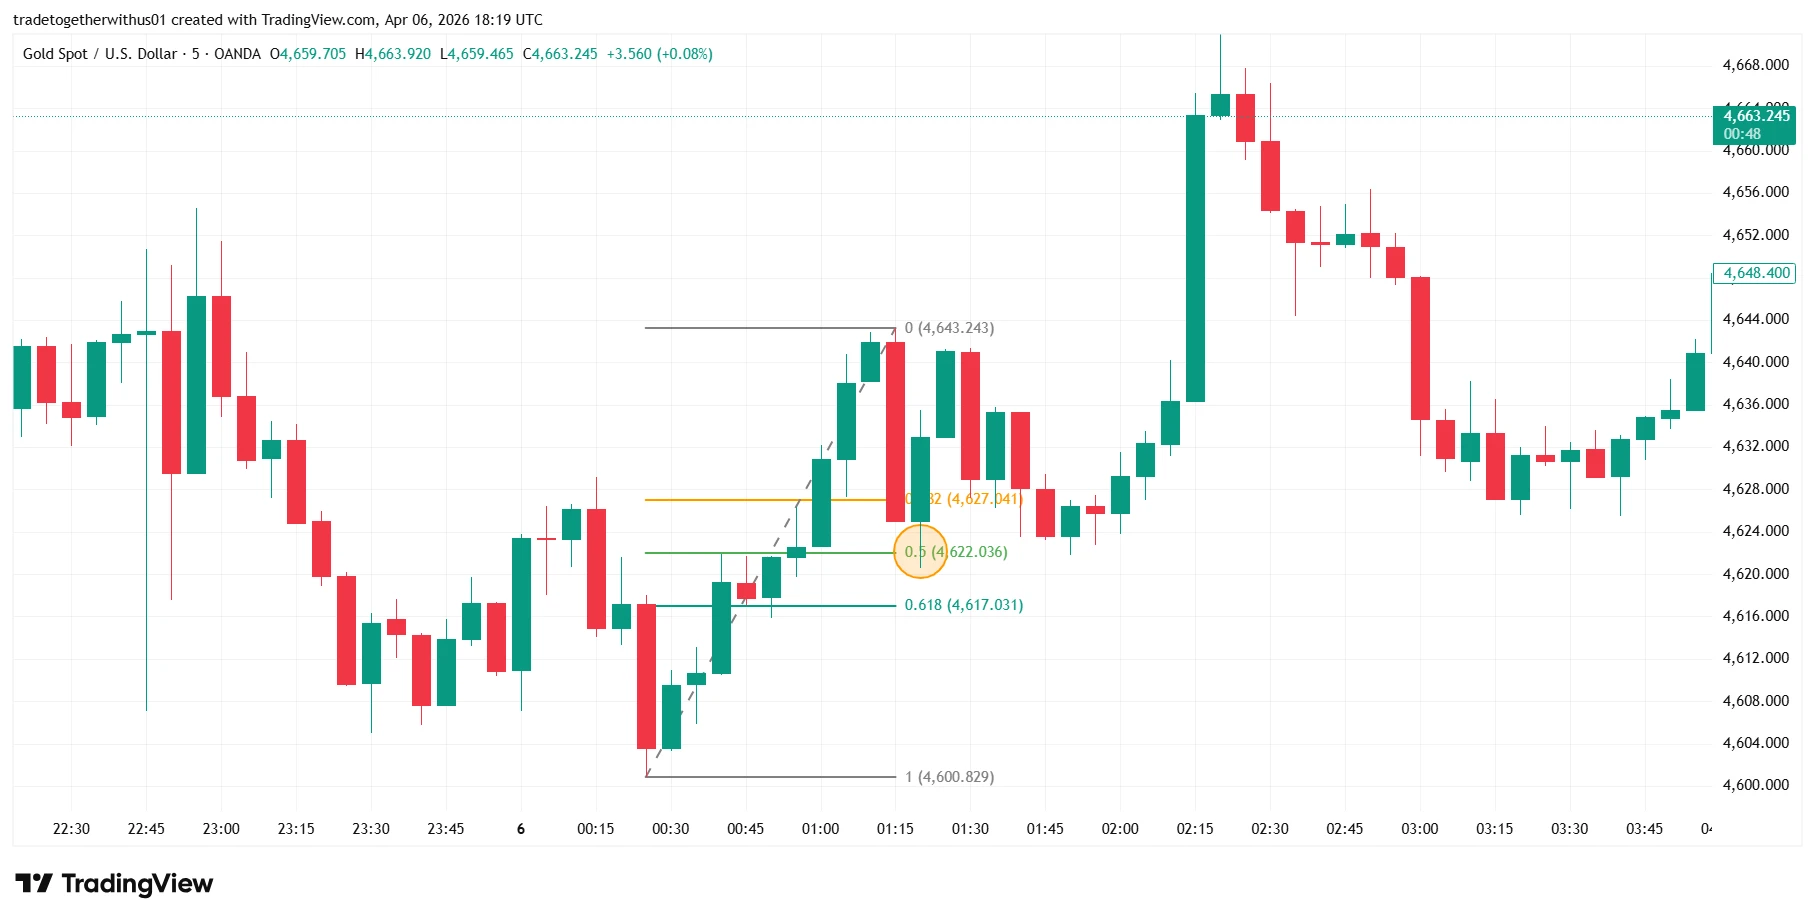
Now let's look at a real market example.
You can see in the XAUUSD (Gold vs US Dollar) chart on 7 April 2026, the market formed a strong upward move before entering a retracement phase.
After identifying the swing low and swing high, the Fibonacci retracement tool was applied to measure the pullback.
As you can see in the image, price moved downward and approached the 0.5 Fibonacci level, where the market started slowing down and showing signs of support.
This demonstrates how Fibonacci retracement can help traders visualize potential pullback zones in real market conditions.
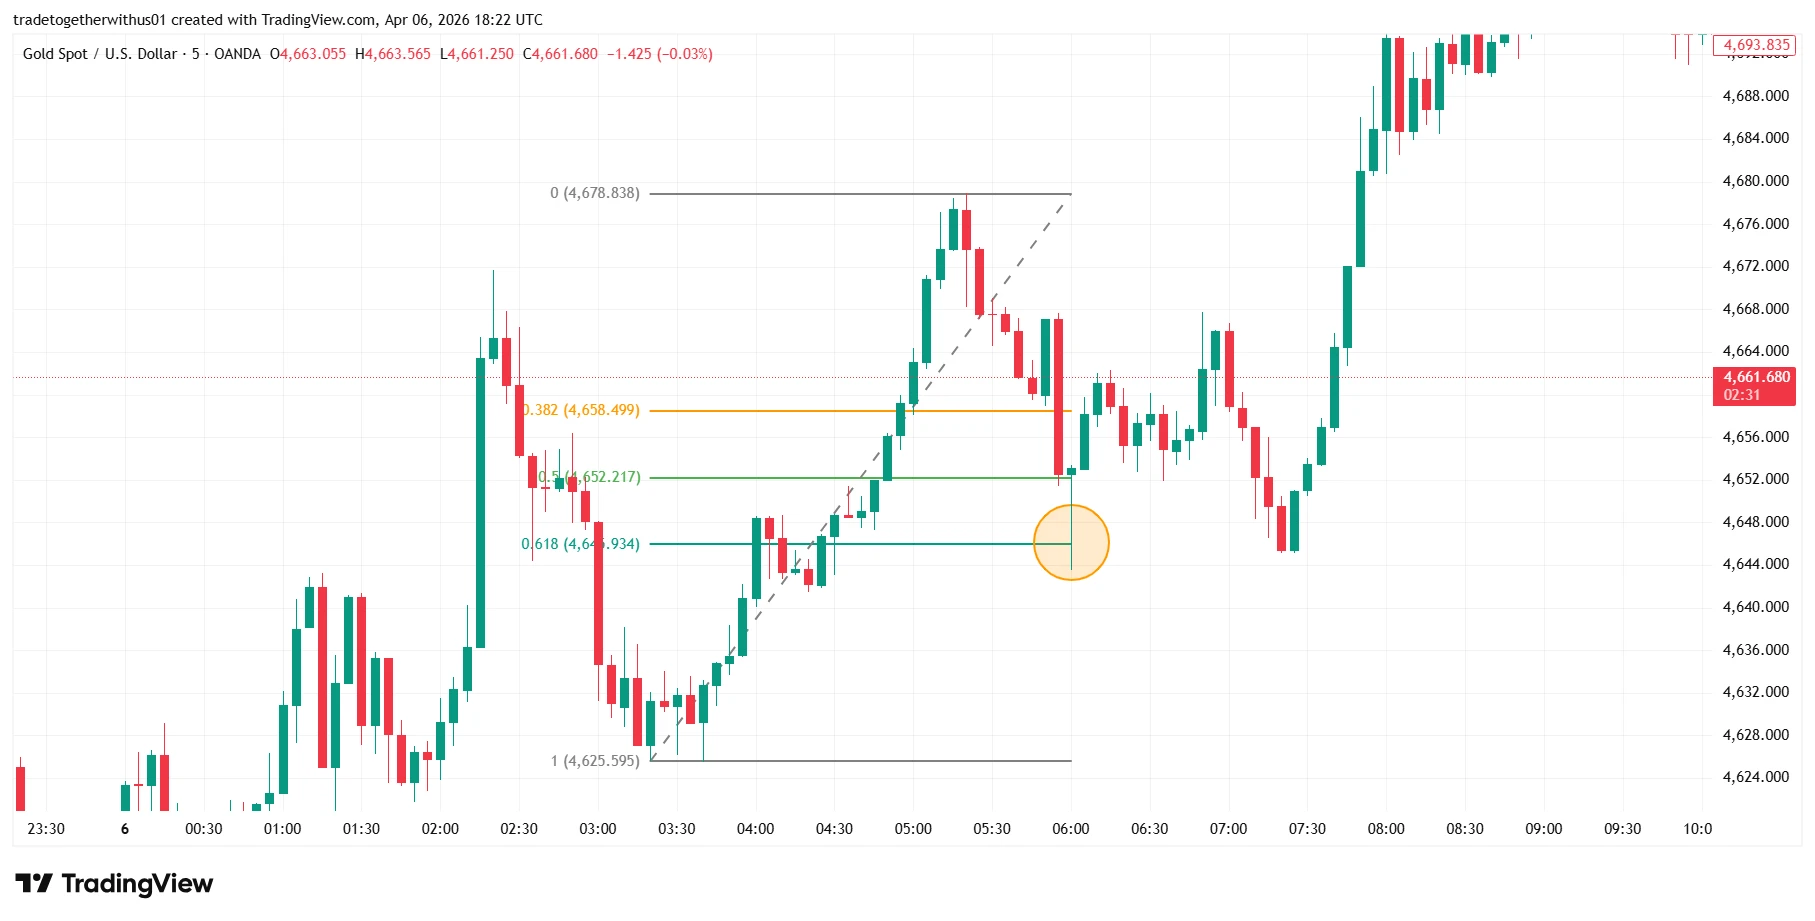
In another example from the same XAUUSD chart, the market retraced toward the 0.618 Fibonacci level, also known as the Golden Ratio.
As shown in the image, price reacted around this level and the market structure began shifting again.
These examples show how Fibonacci retracement levels can highlight important areas where price may react.
However, traders should always remember that markets are uncertain. Responsible trading requires proper risk management and probability-based thinking.
This content is intended for educational purposes only and should not be considered financial advice.
Conclusion
Fibonacci retracement is a powerful technical analysis tool that helps traders identify potential pullback zones within a trend.
By applying Fibonacci levels between swing highs and swing lows, traders can better understand where price reactions may occur. However, Fibonacci should always be used together with market structure analysis and proper risk management.
Frequently Asked Questions (FAQ)
What is Fibonacci retracement in forex trading?
Fibonacci retracement is a technical analysis tool used to identify potential support or resistance levels during market pullbacks.
Which Fibonacci level is most important?
The 61.8% level, known as the Golden Ratio, is one of the most widely watched Fibonacci retracement levels.
Can Fibonacci retracement predict the market?
No. Fibonacci levels highlight potential reaction zones, but markets remain uncertain and require proper risk management.
Should Fibonacci be used alone?
Most professional traders combine Fibonacci retracement with market structure, support and resistance, and risk management.

Written by
Trade Together Research
Trade Together Research is a professional market analysis team providing forex, gold, and crypto trading insights, technical analysis, and educational guides.. Learn more about our research team on the About page.