Chapter 18: Stochastic Oscillator and RSI Indicators in Forex Trading Explained
Sat Apr 04 2026
Introduction
In the previous chapter, we studied how traders use the MACD indicator along with a Moving Average crossover strategy to identify potential momentum shifts in the market. That discussion focused on understanding how momentum indicators can support trading decisions when combined with trend analysis.
If you have not read that chapter, you can review it here:Chapter 17: MACD Indicator Explained in Forex Trading: Combining MACD with Moving Average Crossover Strategy.
In this chapter, we will explore two widely used momentum oscillators in forex trading: the Stochastic Oscillator and the Relative Strength Index (RSI).
Both indicators help traders understand whether the market may be overbought or oversold, which can sometimes signal that momentum is slowing or that the market may be approaching a potential reversal zone.
Part 1: Stochastic Oscillator
What Is the Stochastic Oscillator?
The Stochastic Oscillator is a momentum indicator used to measure the position of the closing price relative to the price range over a specific period.
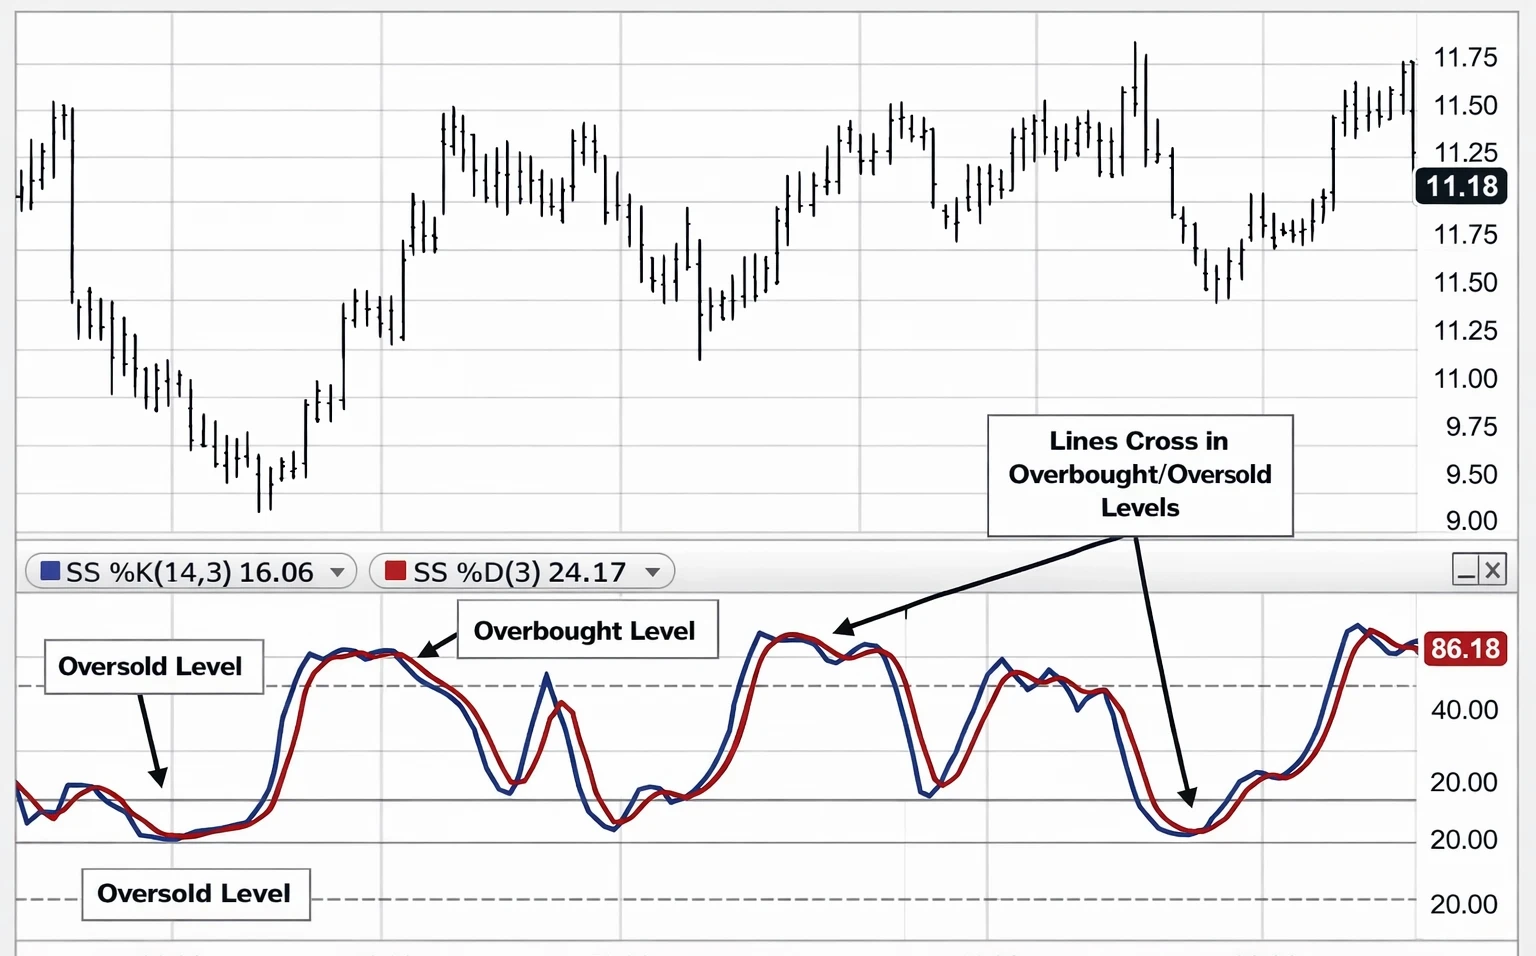
As you can see in the image, the stochastic indicator appears below the price chart and moves between 0 and 100.
These levels help traders identify potential momentum extremes:
- Above 80 → Overbought zone
- Below 20 → Oversold zone
(Some traders also use 70 and 30 levels to identify overbought and oversold conditions depending on their trading style.)
The stochastic indicator contains two lines:
- %K Line – the faster line that reacts quickly to price changes
- %D Line – a smoothed average of the %K line
When these two lines interact, traders can observe changes in momentum.
How the Stochastic Oscillator Is Calculated
The stochastic oscillator compares the current closing price to the highest high and lowest low over a selected period.
This calculation helps determine how strong recent price momentum is relative to the recent price range.
Key components involved in the calculation include:
- Closing Price
- Highest High during the selected period
- Lowest Low during the selected period
From these values, the indicator produces the %K line, which is then smoothed to create the %D line.
(Understanding the calculation is mainly for general knowledge and to understand the logic behind the indicator. There is no need to memorize the formula, since trading platforms automatically calculate it.)
How to Add the TradeTogether Stochastic Indicator to Your Chart
To apply this indicator, you can directly use the TradeTogether Stochastic Indicator available on TradingView.
You can access it using the following link: https://www.tradingview.com/script/70HTpspn-Stochastic-14-3-3/
From this link, you can open the indicator and add it directly to your TradingView chart.
Common Stochastic Indicator Settings
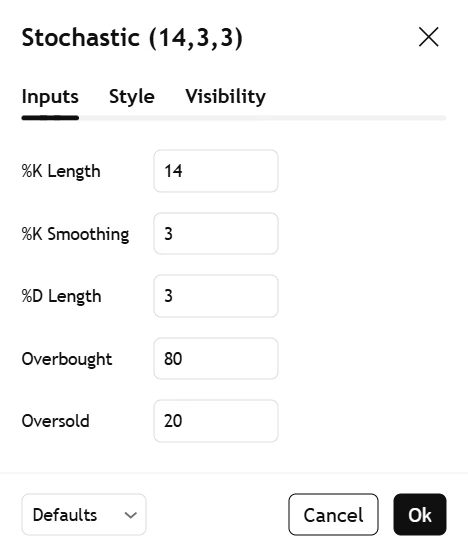
As you can see in the image, the commonly used stochastic configuration is:
- %K Length: 14
- %K Smoothing: 3
- %D Length: 3
This configuration is often referred to as the 14,3,3 stochastic setting, which is widely used among traders.
The indicator also includes two important levels:
- 80 → Overbought level
- 20 → Oversold level
These levels help traders visually identify when the market may be approaching momentum extremes.
How Stochastic Works on the Chart
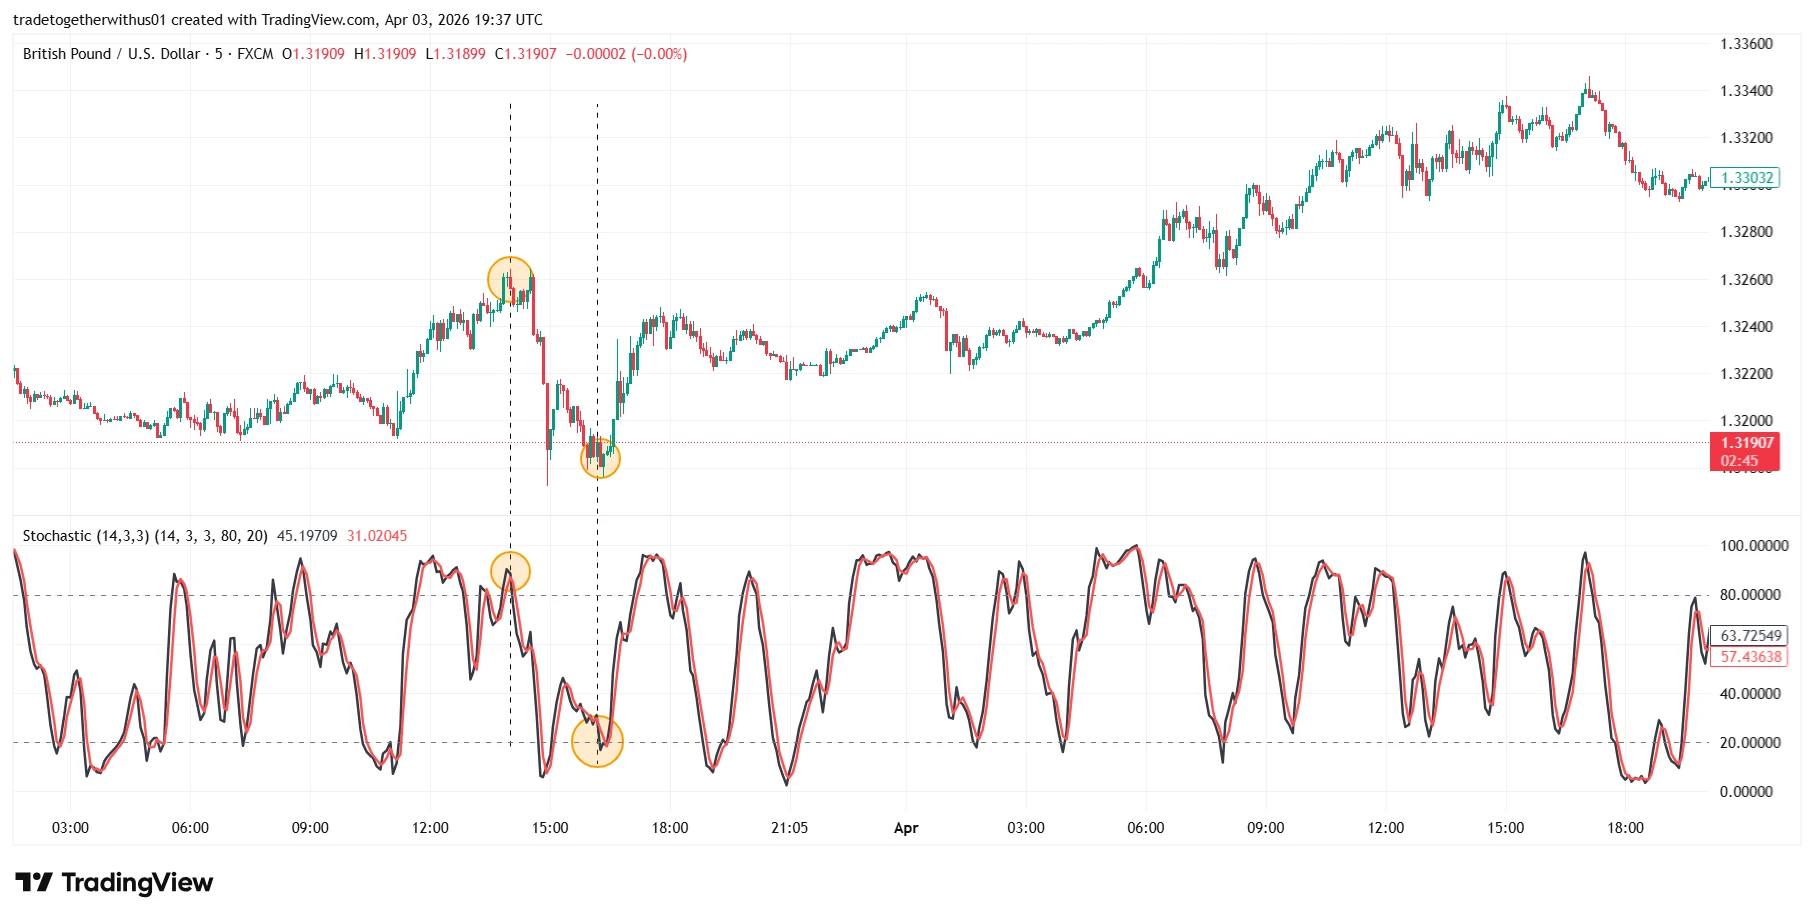
As you can see in the image, the stochastic indicator moves up and down based on market momentum.
Some commonly observed behaviors include:
Overbought Zone
When the indicator moves above 80, the market may be experiencing strong bullish momentum. However, this does not necessarily mean the market will immediately fall. Instead, it suggests that buying momentum may be slowing.
Oversold Zone
When the indicator moves below 20, it suggests that selling pressure has been strong. This can sometimes indicate that the market is approaching a potential exhaustion phase.
Line Crossovers
When the %K line crosses above the %D line, it may indicate increasing upward momentum.
When the %K line crosses below the %D line, it may indicate weakening momentum.
These signals should always be interpreted in the context of broader market conditions such as trend direction, support and resistance, and liquidity levels.
Part 2: Relative Strength Index (RSI)
What Is the Relative Strength Index (RSI)?
The Relative Strength Index (RSI) is another widely used momentum oscillator that measures the speed and strength of price movements.
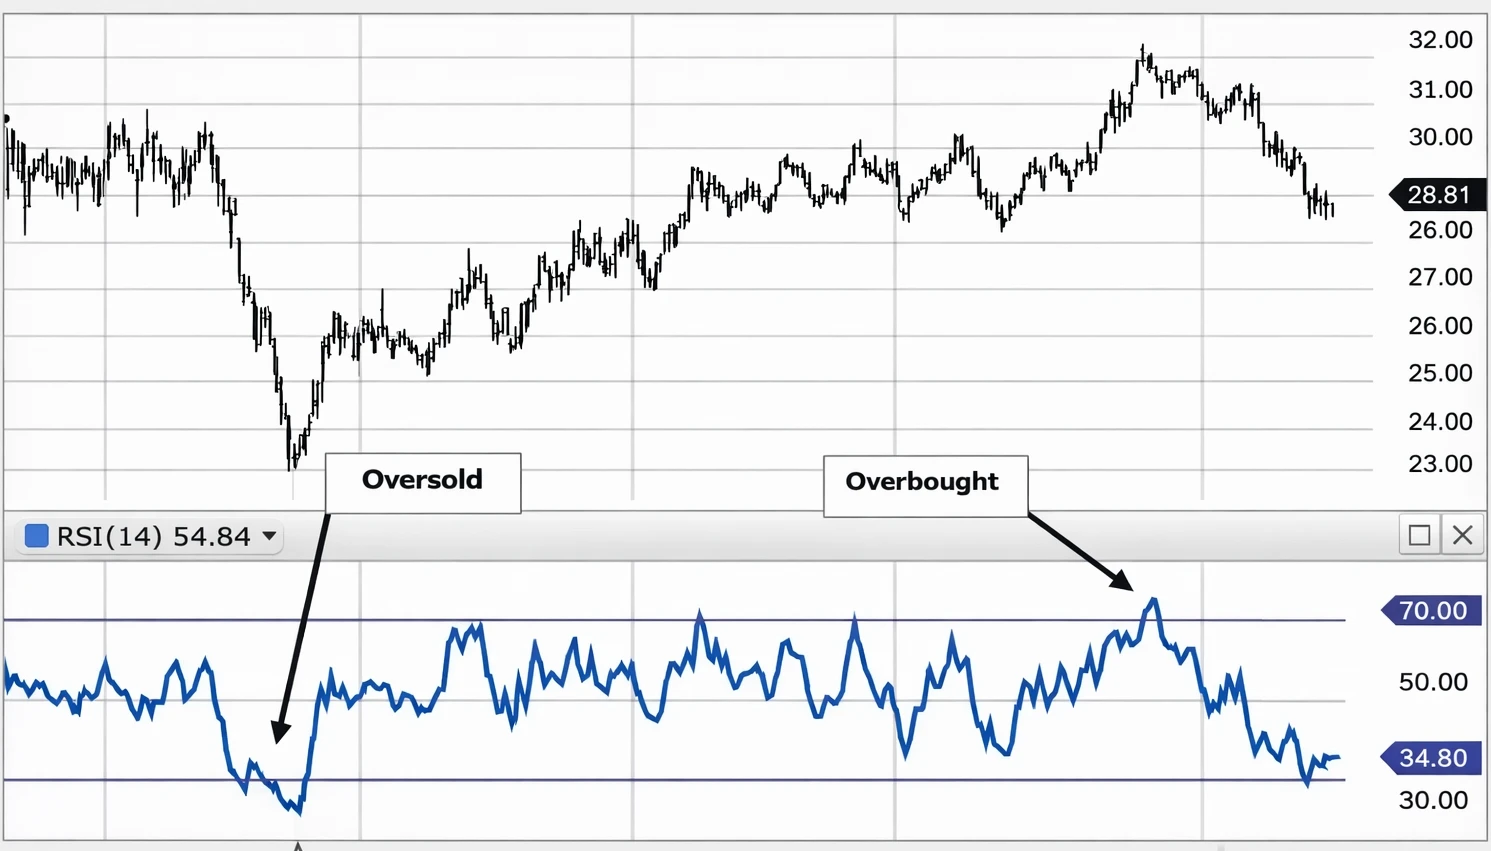
As you can see in the image, the RSI also moves between 0 and 100, similar to the stochastic indicator.
Common levels used by traders include:
- Above 80 → Overbought zone
- Below 20 → Oversold zone
(Some traders also use 70 and 30 levels depending on their strategy.)
The RSI helps traders understand whether recent price movements have been dominated by buying pressure or selling pressure.
How RSI Is Calculated
RSI is calculated by comparing the average gains and average losses over a specific period, usually 14 periods.
The calculation produces a value between 0 and 100, which reflects the strength of recent price movement.
A higher value indicates stronger buying momentum, while a lower value indicates stronger selling pressure.
(Again, this formula is explained mainly for understanding the concept. Traders do not need to memorize the formula, as trading platforms automatically calculate RSI values.)
How to Add the TradeTogether RSI Indicator to the Chart
You can add the TradeTogether RSI Indicator directly using the following link: https://www.tradingview.com/script/j0ZEh8ZW-RSI-14-80-20-Zones/
From this link, you can open the indicator and apply it directly to your TradingView chart.
Common RSI Indicator Settings
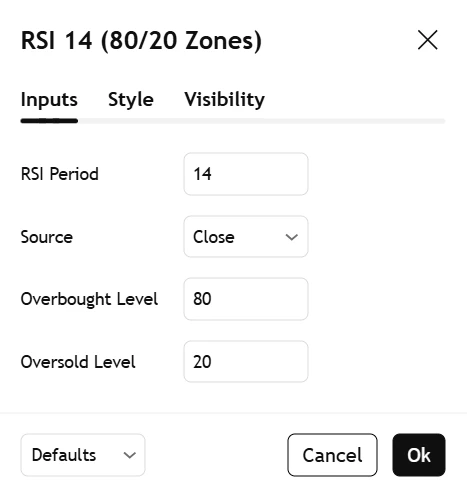
As you can see in the image, the commonly used RSI configuration includes:
- RSI Period: 14
- Overbought Level: 80
- Oversold Level: 20
(Some traders may use 70 and 30 levels depending on their trading style.)
These levels help identify potential areas where momentum may be reaching extreme conditions.
How RSI Works on the Chart
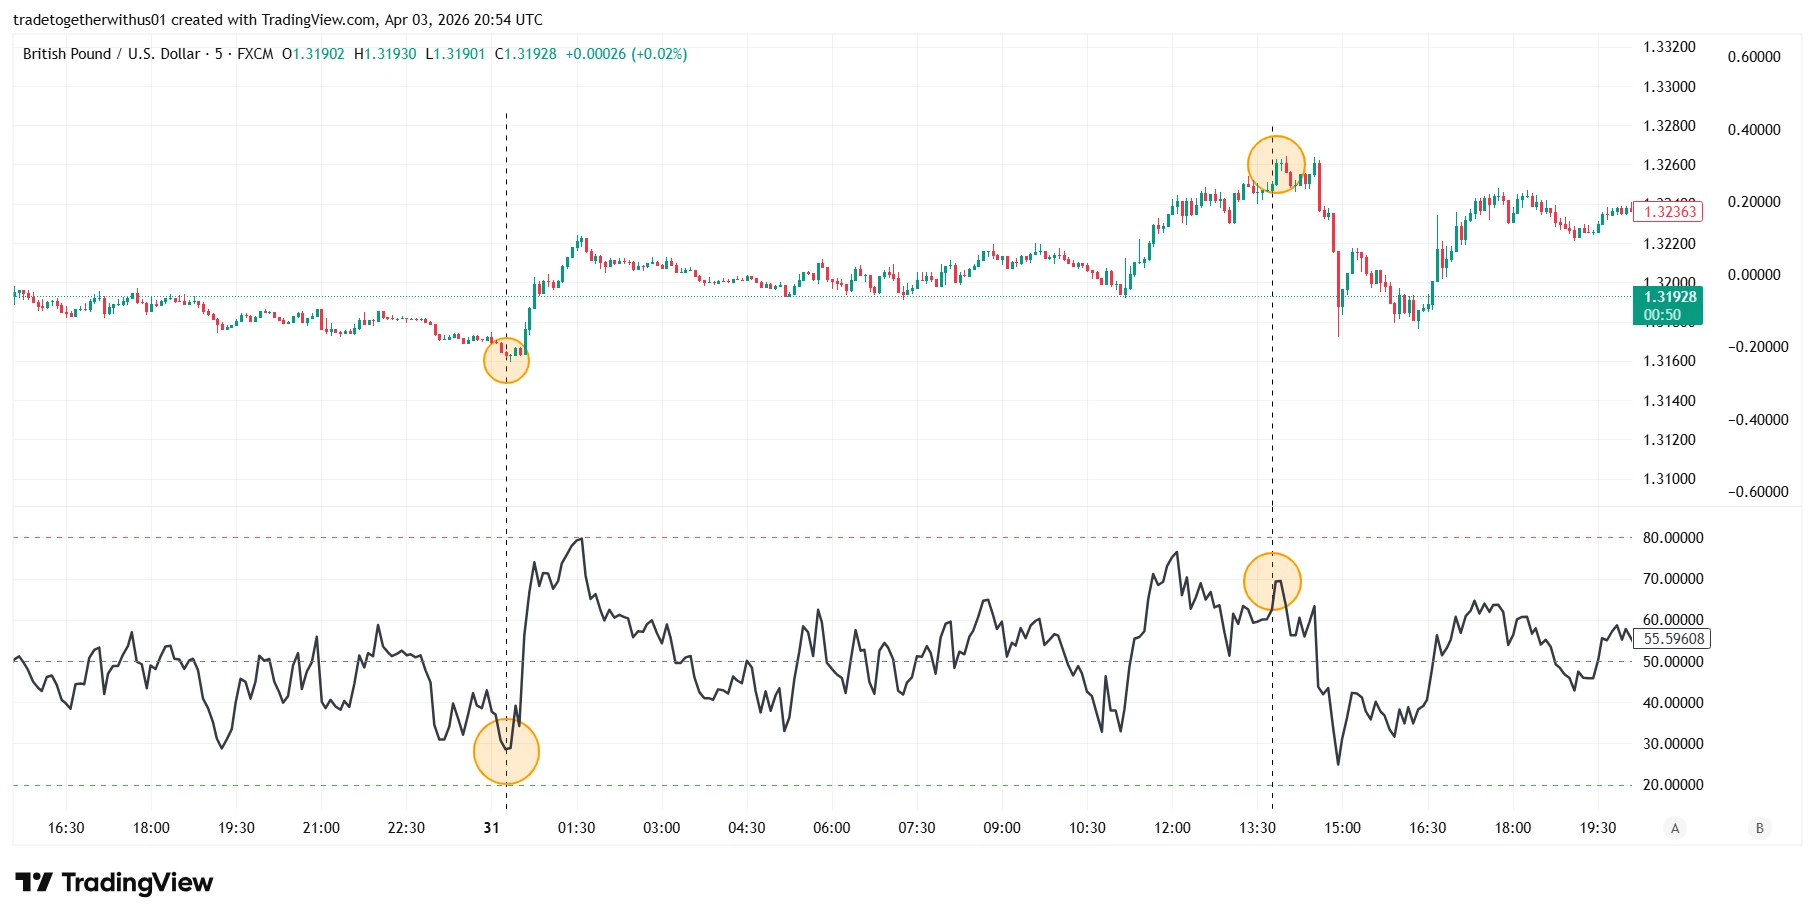
As you can see in the image, the RSI moves up and down depending on the strength of price movements.
Overbought Zone
When RSI rises above the overbought level, the market may be experiencing strong bullish momentum.
Oversold Zone
When RSI drops below the oversold level, the market may be experiencing strong selling pressure.
These signals do not guarantee a reversal, but they can provide additional context when combined with price action, trend analysis, and market structure.
Key Difference Between Stochastic and RSI
Although both indicators measure momentum, they behave slightly differently in various market conditions.
| Indicator | Common Use | ||
|---|---|---|---|
| Stochastic Oscillator | Often used in sideways or range-bound markets | ||
| RSI | Often used to measure strength during trends |
Many traders study both indicators to better understand market momentum from different perspectives.
Conclusion
Both Stochastic Oscillator and Relative Strength Index (RSI) are widely used momentum indicators in forex trading. They help traders understand when the market may be approaching overbought or oversold conditions, which can provide insight into potential momentum shifts.
However, it is important to remember that no technical indicator works perfectly in all market conditions. Indicators should always be used alongside broader analysis such as market structure, liquidity zones, and overall trend direction.
Traders should also focus on risk management, including the use of stop-loss orders and appropriate position sizing to protect trading capital.
The information provided in this article is intended for educational purposes only and should not be considered financial advice.
Frequently Asked Questions
Are RSI and Stochastic the same?
No. While both indicators measure momentum and identify overbought or oversold conditions, they use different calculation methods and respond differently to price movement.
Can these indicators predict market reversals?
No indicator can guarantee market reversals. These tools only highlight potential momentum extremes.
Which indicator is better for beginners?
Both RSI and Stochastic are commonly used by beginners because they are visually easy to understand. However, they should always be used alongside risk management and proper market analysis.

Written by
Trade Together Research
Trade Together Research is a professional market analysis team providing forex, gold, and crypto trading insights, technical analysis, and educational guides.. Learn more about our research team on the About page.