Chapter 16: Moving Average Indicator Guide: Understanding SMA, EMA and the Moving Average Crossover Strategy
Sat Mar 28 2026
Introduction
In the previous chapter of this forex learning series, we discussed multiple candlestick patterns and how traders interpret market behavior using price action.
If you have not read that article yet, you can read it here: Chapter 15: Forex Reversal Candlestick Patterns Explained: Engulfing, Harami and Star Patterns for Beginners.
In this chapter, we will move to the next important concept in technical analysis — Moving Averages and how traders use them to understand market trends and momentum.
Part 1: Understanding What an Average Is
Before learning about moving averages, we first need to understand what an average means.
An average is simply the typical value of a group of numbers.
For example, imagine a student scoring the following marks:
- Test 1: 60
- Test 2: 70
- Test 3: 80
- Test 4: 90
- Test 5: 100
To calculate the average:
60 + 70 + 80 + 90 + 100 = 400
400 ÷ 5 = 80
So the average score is 80.
Even though each test score is different, the student's overall performance can be summarized around 80.
This same concept is used in financial markets to understand average price behavior over time.
What Is a Moving Average?
A Moving Average (MA) is a technical indicator that calculates the average price of an asset over a specific number of candles.
For example:
A 20-period moving average calculates the average price of the last 20 candles.
When a new candle forms:
- The newest price is added
- The oldest candle is removed
Because the calculation constantly updates, the line on the chart moves along with price, which is why it is called a moving average.
Moving averages help traders:
- Understand the overall market trend
- Reduce short-term price noise
- Observe momentum changes
However, moving averages are lagging indicators, meaning they are based on past price data.
What Information Moving Averages Can Provide
To understand this concept better, imagine a shop owner tracking daily income.
For several days the income is:
- Day 1: $20
- Day 2: $20
- Day 3: $20
- Day 4: $20
- Day 5: $20
The average income is $20.
Now imagine the next days are:
- Day 6: $25
- Day 7: $27
- Day 8: $30
Now the income is above the average, indicating the business may be improving.
If the income drops:
- Day 6: $18
- Day 7: $15
- Day 8: $14
Now the income is below the average, suggesting weakness.
Moving averages help traders observe the same concept in markets.
Part 2: Using Our Moving Average Indicator
To make learning easier, we developed a TradingView Moving Average Indicator for educational purposes.
You can add our indicator directly to your chart using this link:
TradeTogether Ultimate Moving Average, ( https://www.tradingview.com/script/1HFP6DDz-TradeTogether-Ultimate-Moving-Average/).
This indicator allows traders to easily study moving averages and understand how they behave in different market conditions.
Understanding the Indicator Interface

As you can see in the image , this is the basic interface of our moving average indicator settings.
Here you can configure different parameters such as:
- Field
- Main Moving Average Period
- Moving Average Type
- Additional Moving Averages
These settings allow traders to customize how the indicator works on the chart.
Field (Price Source)
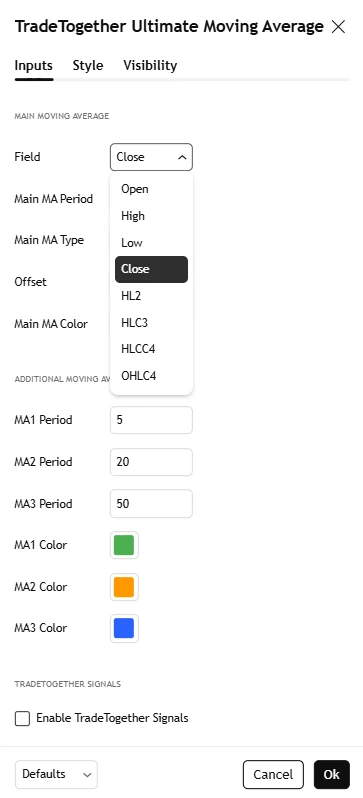
As you can see in the image , the Field option allows you to select which price value will be used to calculate the moving average.
Available options include:
- Open
- High
- Low
- Close
- HL2
- HLC3
- HLCC4
- OHLC4
Among these options, most traders prefer using Close price, because it represents the final agreed price of the candle.
Note: For beginners, it is recommended to use Close.
Moving Average Period
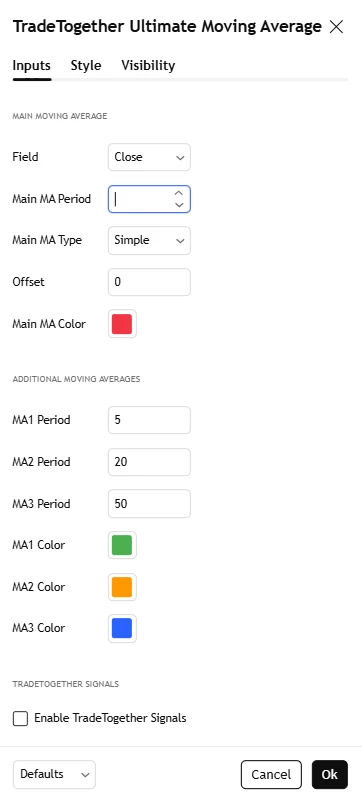
As shown in the image , the Main MA Period represents the number of candles used to calculate the moving average.
For example:
- 10 period = average of last 10 candles
- 20 period = average of last 20 candles
- 50 period = average of last 50 candles
Smaller periods react faster to price movement, while larger periods produce smoother trend lines.
Moving Average Types
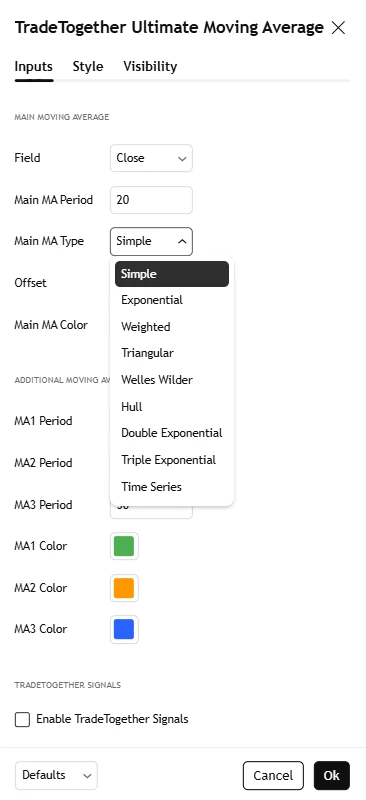
As you can see in the image, there are different types of moving averages available.
The two most commonly used types are:
Simple Moving Average (SMA)
This calculates the average price evenly across the selected number of candles.
Exponential Moving Average (EMA)
This gives more weight to recent price movements, making it more responsive.
Both are widely used by traders depending on their strategy.
Style Settings
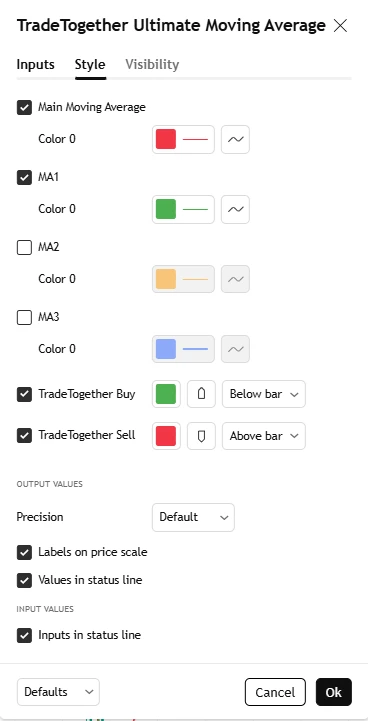
As shown in the image, the Style section allows you to enable or disable different moving averages.
The indicator includes:
- Main Moving Average
- MA1
- MA2
- MA3
You can enable or disable these depending on your preference.
In our example, we mainly use:
- Main Moving Average (20 Period)
- MA1 (5 Period)
This combination helps demonstrate the moving average crossover strategy.
Example: 20 Period Simple Moving Average
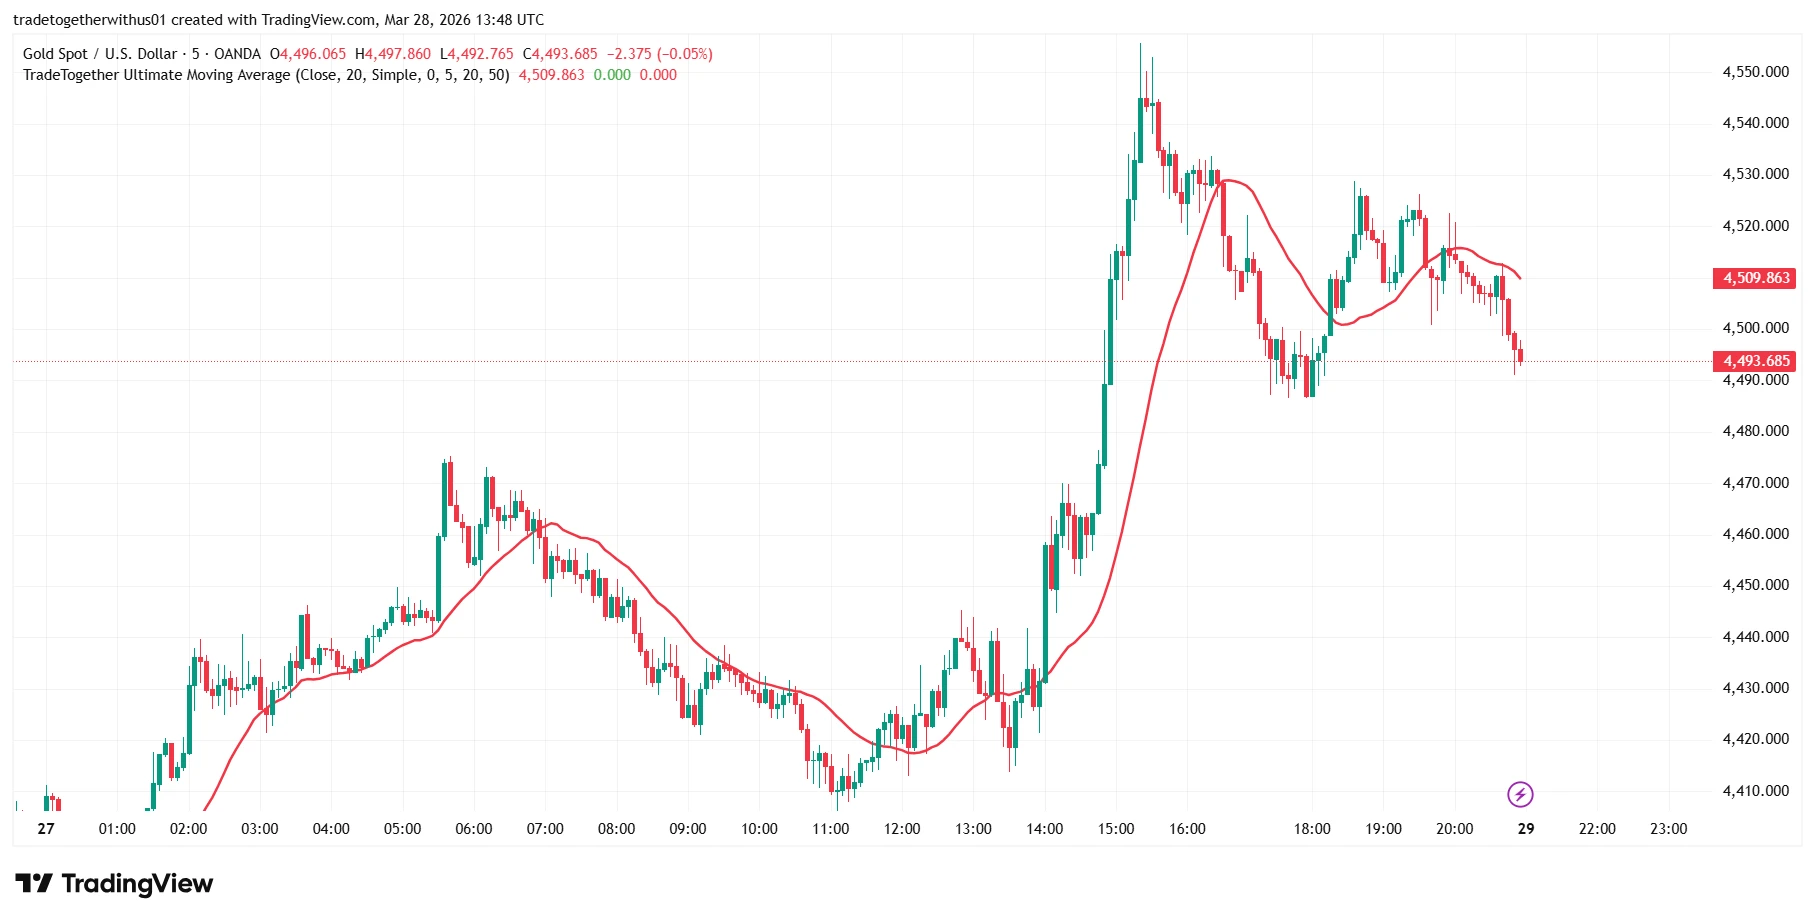
As you can see in the image, the chart displays a 20-period Simple Moving Average (20 SMA).
This line represents the average closing price of the last 20 candles.
Traders often use this to understand the general trend direction.
If price remains above the moving average, the market may be showing strength. If price moves below it, it may indicate weakness.
Part 3: Moving Average Crossover Strategy
One of the most commonly studied concepts in technical analysis is the Moving Average Crossover Strategy.
In this example, we use two moving averages:
- 5-period Simple Moving Average (5 SMA) – short-term average
- 20-period Simple Moving Average (20 SMA) – longer-term average
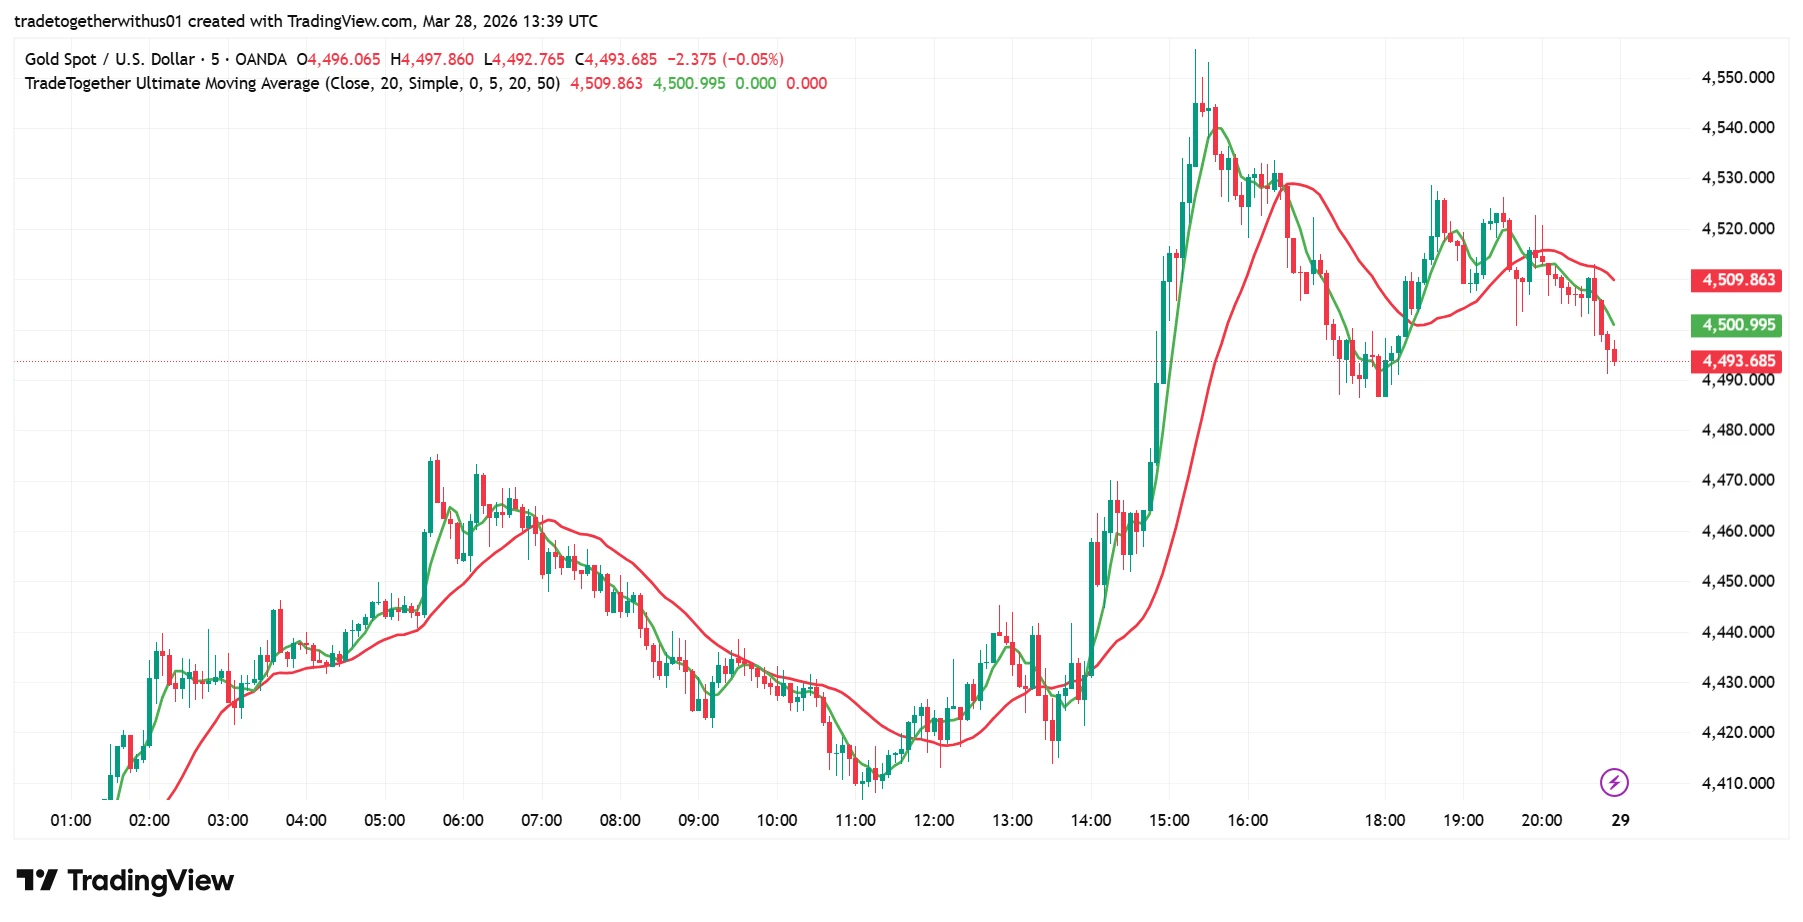
In the chart shown in Image 7, you can see this example applied to the XAUUSD 5-minute chart.
Here:
- The green line represents the 5 SMA
- The red line represents the 20 SMA
Understanding the Logic Behind the Crossover
To understand why traders observe moving average crossovers, we need to understand what these averages represent.
The 5 SMA represents the average price of the last 5 candles.
The 20 SMA represents the average price of the last 20 candles.
This means:
- The 5 SMA reflects short-term market behavior
- The 20 SMA reflects longer-term market behavior
When the 5 SMA moves above the 20 SMA, it means the recent price movement is stronger than the longer-term average.
In other words, the short-term market activity is improving faster than the broader trend.
This can indicate increasing upward momentum.
On the other hand, when the 5 SMA moves below the 20 SMA, it means the recent price movement is weaker than the longer-term average.
This may indicate weakening momentum or downward pressure.
Simple Example to Understand the Logic
Imagine a shop owner comparing his income.
Suppose the average income over the last 30 days is $100 per day.
Now he calculates the average income over the last 5 days, and it comes to $140 per day.
This means the recent business performance is stronger than the long-term average, which suggests the business may be improving.
But if the last 5 days average drops to $70 per day, it means the recent performance is weaker than the longer-term average, suggesting the business may be slowing down.
Moving averages apply the same logic to market prices.
Observing the Crossover on the Chart
As you can see in the image, when the green 5 SMA crosses above the red 20 SMA, the market begins to show upward movement.
When the green 5 SMA crosses below the red 20 SMA, the market begins to move downward.
However, it is important to remember that moving averages are lagging indicators.
They react to price movements rather than predicting them.
Because of this, crossover signals are often used as confirmation tools rather than standalone decision systems.
Traders often combine moving averages with:
- Support and resistance levels
- Market structure analysis
- Volatility observation
- Risk management strategies
Using multiple forms of analysis helps traders develop a more balanced understanding of market conditions.
Part 4: Enabling the TradeTogether Signal Feature
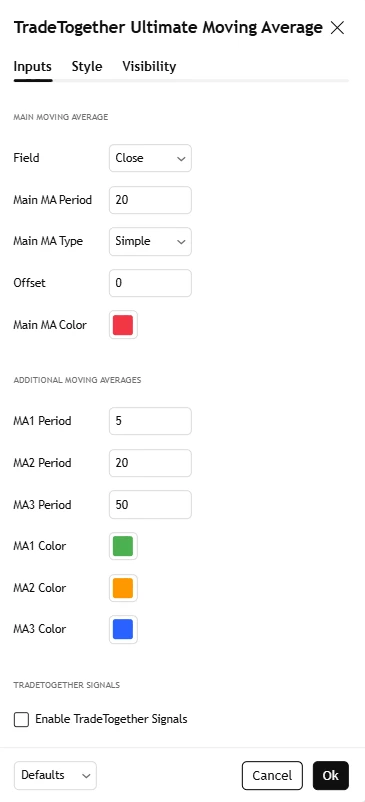
At the bottom of the indicator settings, as you can see in Image , there is an option called Enable TradeTogether Signals.
If you tick this option and click OK, the indicator will activate our built-in crossover signal system.
This system is built using the moving average crossover logic along with several additional concepts designed to help traders observe potential market movements.
Example of Indicator Signals
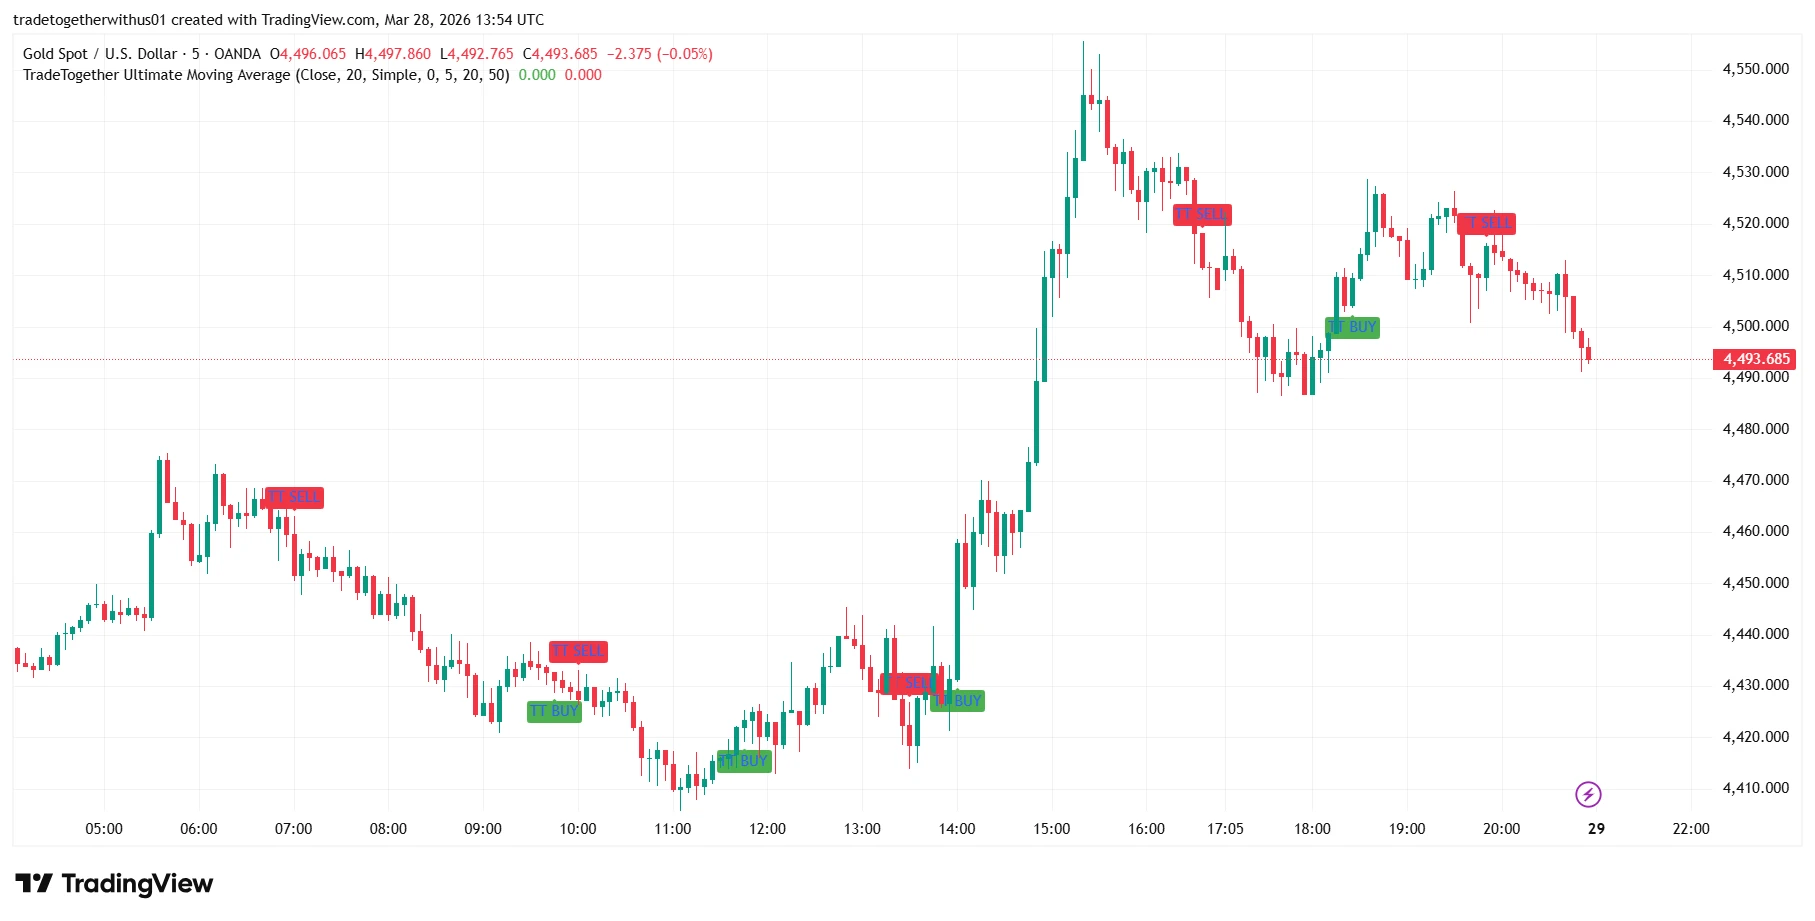
As you can see in Image , the indicator automatically displays Buy and Sell signals when certain crossover conditions occur.
In many cases, these signals align with significant price movements.
However, it is important to understand that no indicator works perfectly all the time.
Markets are influenced by many factors such as:
- Volatility
- Liquidity
- Economic events
- Market sentiment
Because of this, traders should not rely on a single indicator alone.
Instead, these signals should be used as additional confirmation alongside your own trading strategy or analysis.
Conclusion
Moving averages help traders understand the average price and overall trend of the market. By comparing short-term and long-term averages, traders can observe changes in market momentum, such as the moving average crossover discussed in this chapter.
However, moving averages are lagging indicators based on past price data, so they may not work perfectly in every market condition. For this reason, traders often use them as a confirmation tool alongside their own strategy and analysis.
This article is intended for educational purposes only, helping traders understand how moving averages behave in financial markets.

Written by
Trade Together Research
Trade Together Research is a professional market analysis team providing forex, gold, and crypto trading insights, technical analysis, and educational guides.. Learn more about our research team on the About page.