Chapter 15: Forex Reversal Candlestick Patterns Explained: Engulfing, Harami and Star Patterns for Beginners
Wed Mar 25 2026
Introduction
In previous chapters, we explored how candlestick charts help traders understand market sentiment and price movement. Candlestick analysis allows traders to observe the ongoing interaction between buyers and sellers and identify potential turning points in the market.
Before learning complex candlestick formations, it is important to understand the basic single candlestick patterns that represent fundamental market behavior. If you want to review these basic formations such as Marubozu, Doji, Spinning Top, and Paper Umbrella, you can read our earlier guide on single candlestick patterns here:Types of Candlesticks in Trading: Marubozu, Doji, Spinning Top and More — And Their Applications.
Once traders understand individual candles, the next step is learning multiple candlestick patterns, where two or three candles combine to reveal deeper market psychology.
These patterns help traders understand potential trend reversals, continuation signals, and shifts in market momentum. However, candlestick patterns should always be interpreted within the broader context of trend analysis, support and resistance levels, and market structure.
For example, professional traders often study these patterns alongside real chart analysis. You can see an example of practical chart interpretation in this analysis:AUDUSD 1-Hour Price Analysis — Order Block Reaction and Volume-Based Structural Zone in Focus: Wednesday, March 25, 2026.
In this chapter, we will explore some of the most important multi-candlestick reversal patterns used by traders, including engulfing patterns, harami formations, gap patterns, and star formations.
Understanding Multiple Candlestick Patterns in Trading
Multiple candlestick patterns form when two or more consecutive candles interact with each other, revealing shifts in market sentiment.
These patterns help traders identify:
- Possible trend reversals
- Signs of market indecision
- Potential continuation of momentum
- Changes in buyer and seller dominance
Unlike single candlestick patterns, multi-candle formations provide additional confirmation because they reflect price action across multiple trading sessions.
For beginner traders, these patterns act as visual clues that help interpret the behavior of market participants.
Bullish and Bearish Engulfing Candlestick Patterns
One of the most widely used reversal patterns in technical analysis is the engulfing pattern.
An engulfing pattern consists of two candles, where the body of the second candle completely covers the body of the first candle.
Bullish Engulfing Pattern
A bullish engulfing pattern typically forms during a downtrend.
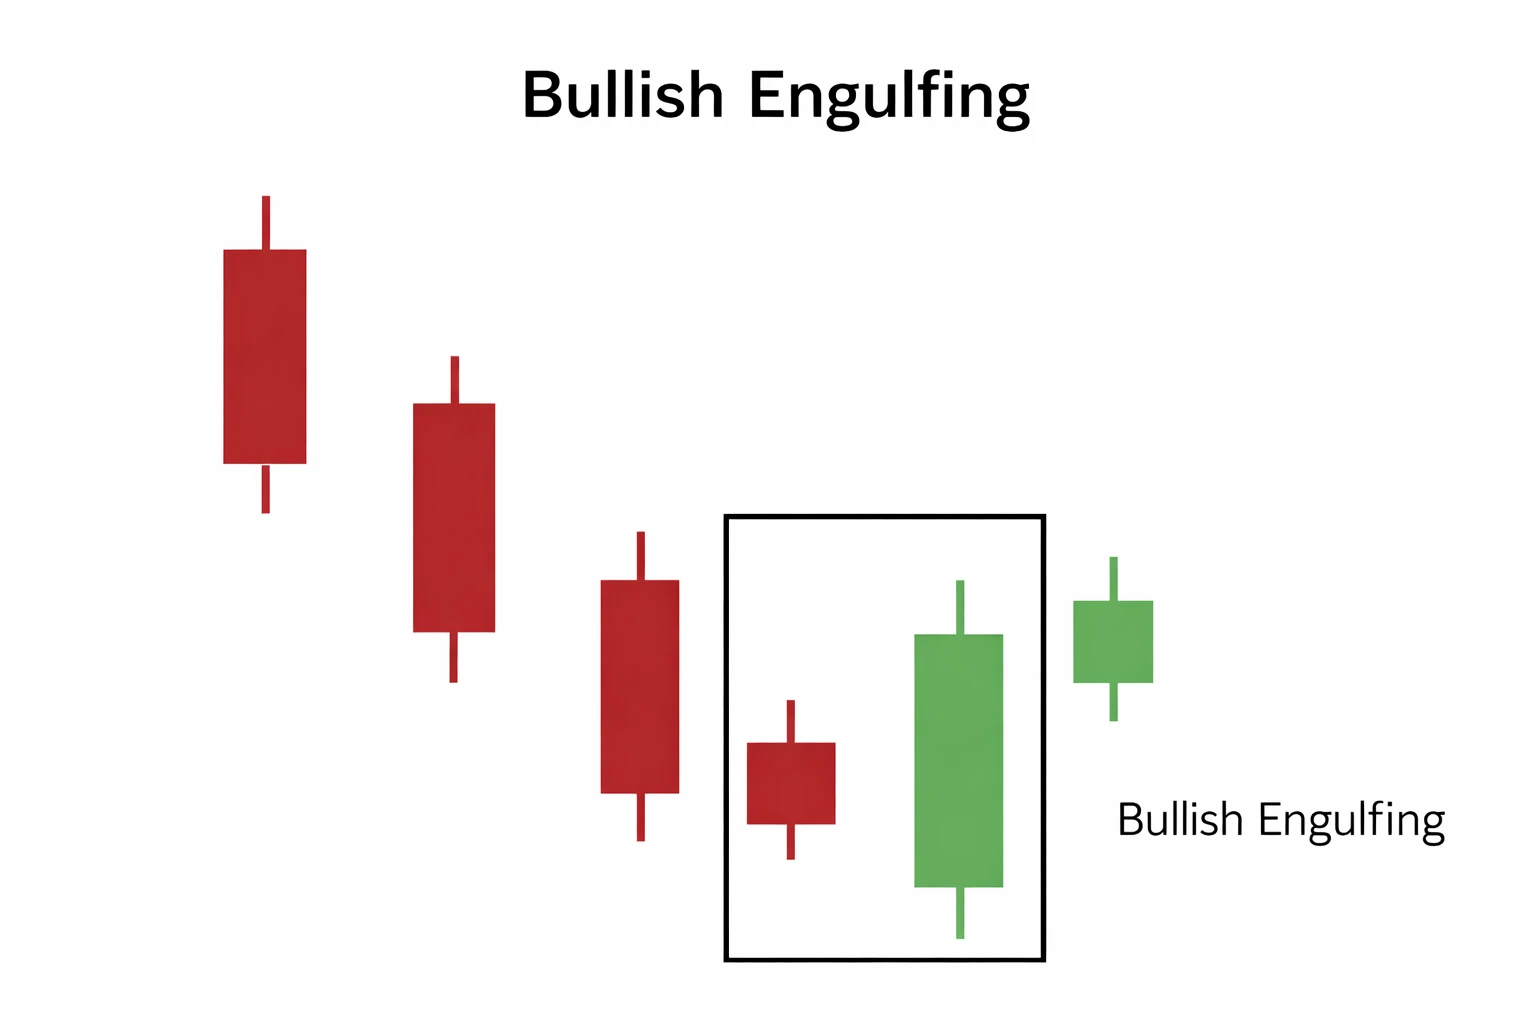
Structure:
- First candle is bearish
- Second candle is bullish
- The body of the second candle completely engulfs the previous candle
This pattern suggests that buyers have suddenly gained strong momentum, potentially reversing the previous downward movement.
Market psychology behind this pattern:
- Sellers initially dominate the market
- Buyers step in aggressively
- Market sentiment shifts toward bullish pressure
However, traders should confirm the pattern using support levels, trend direction, or other technical tools.
Bearish Engulfing Pattern
The bearish engulfing pattern forms during an uptrend.
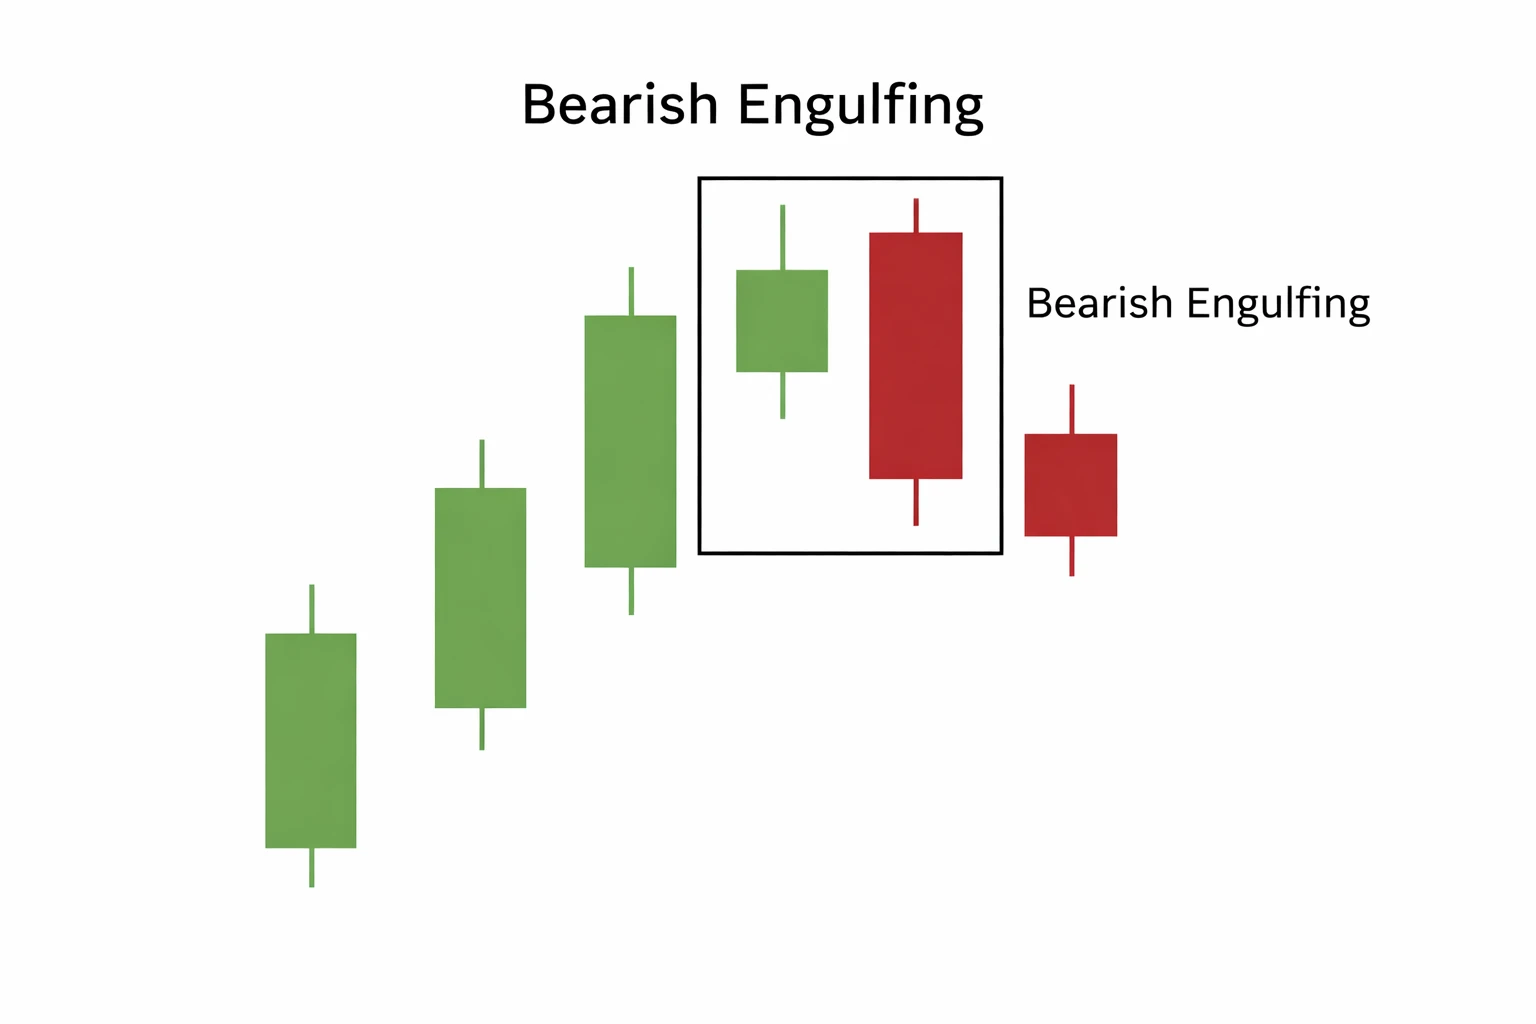
Structure:
- First candle is bullish
- Second candle is bearish
- The second candle completely covers the previous candle's body
This indicates that selling pressure has overtaken buying momentum, which may signal a potential reversal.
Even though engulfing patterns are considered strong signals, traders should always evaluate them within the broader market structure and liquidity zones.
Partial Engulfing Patterns: Piercing Pattern and Dark Cloud Cover
Partial engulfing patterns occur when the second candle overlaps a significant portion of the previous candle but does not completely engulf it.
Piercing Pattern
The piercing pattern is a bullish reversal signal that appears during a downtrend.
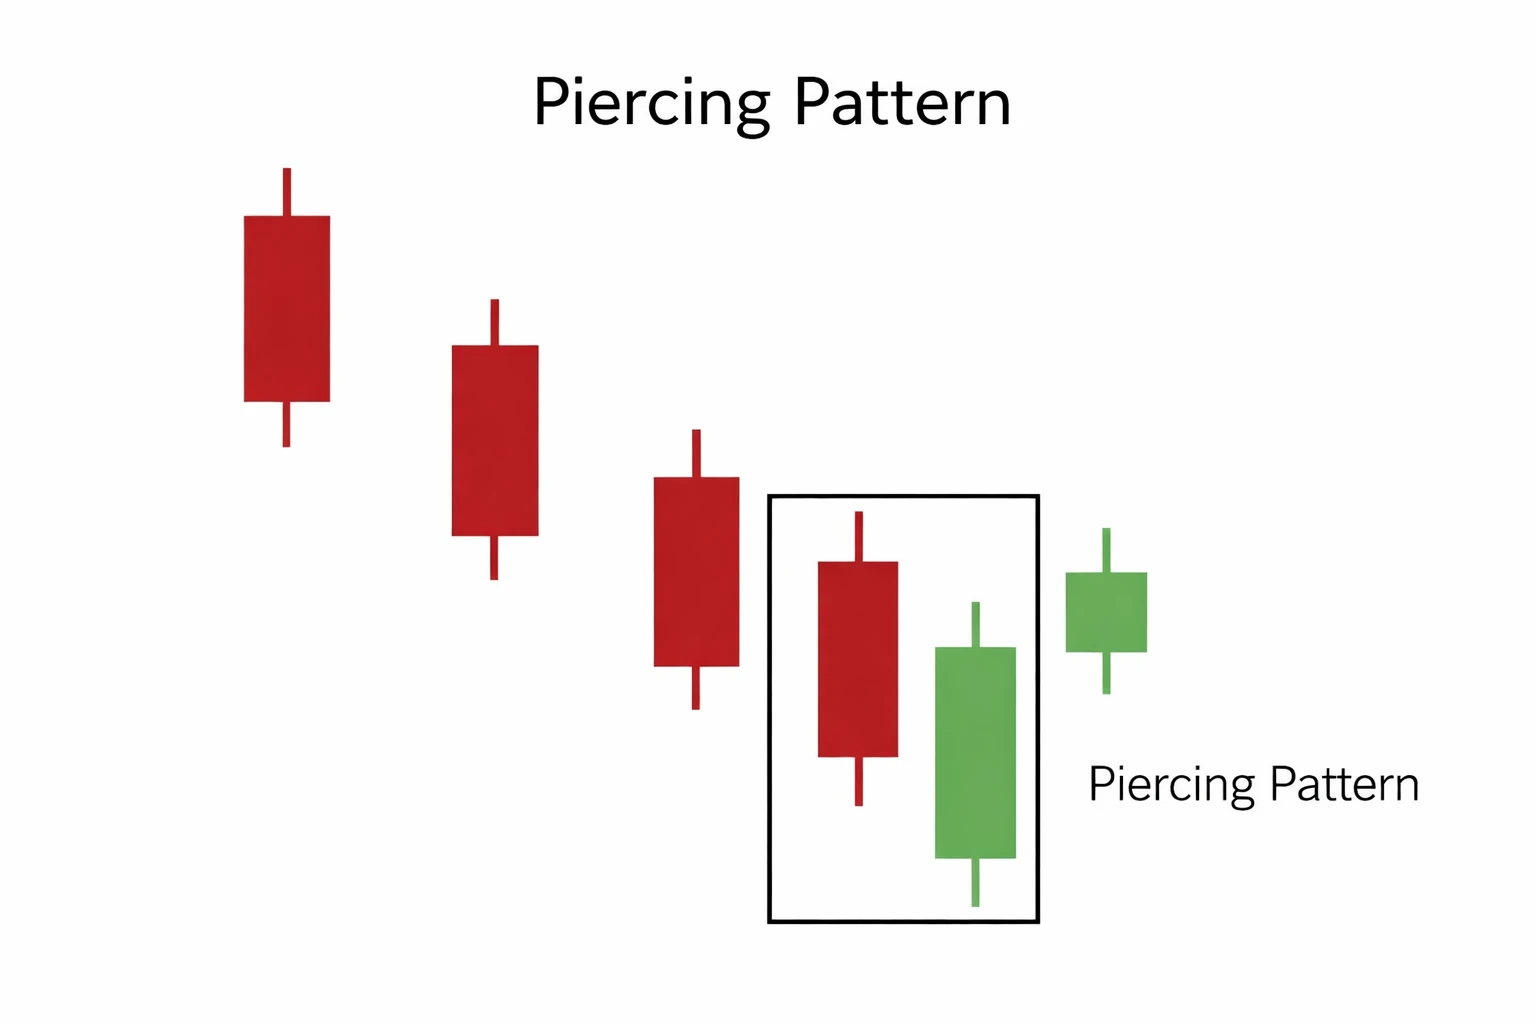
Structure:
- First candle is bearish
- Second candle is bullish
- The second candle closes above the midpoint of the first candle
This indicates that buyers are beginning to challenge the existing selling pressure.
Dark Cloud Cover
The dark cloud cover pattern is the bearish counterpart of the piercing pattern.
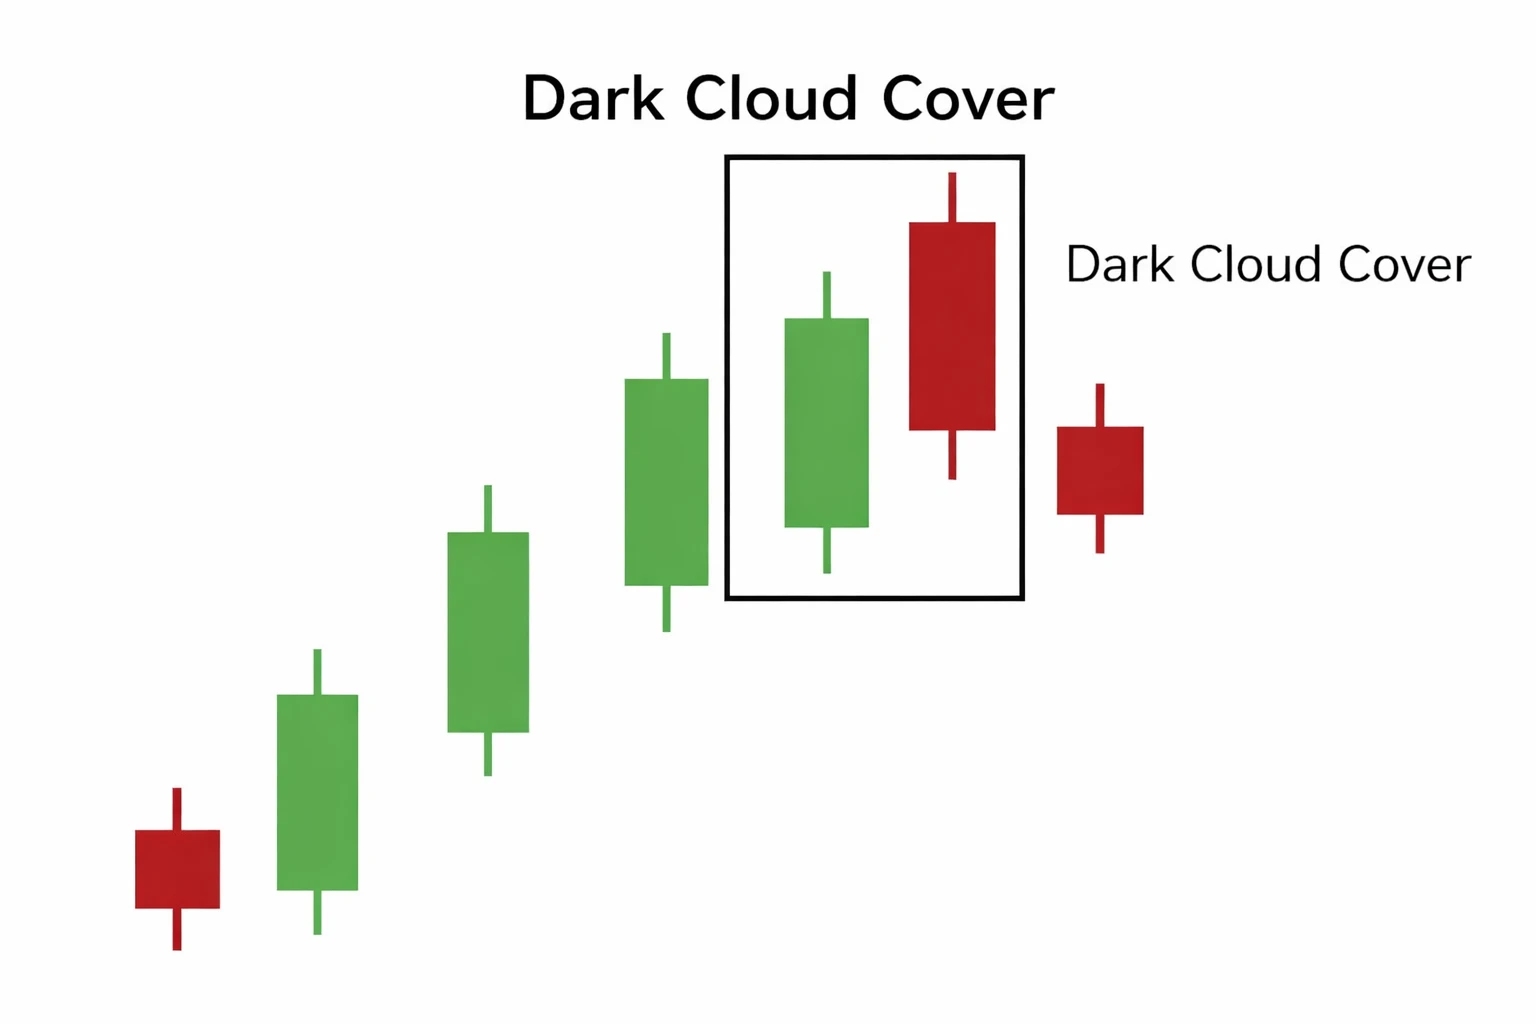
Structure:
- Appears during an uptrend
- First candle is bullish
- Second candle is bearish
- The second candle closes below the midpoint of the first candle
This suggests that sellers are gaining control and the market may experience a reversal.
These patterns represent early signs of potential trend shifts rather than immediate trading signals.
Harami Candlestick Pattern and Market Indecision
The Harami pattern is another two-candle formation that represents market hesitation.
In this pattern:
- The first candle is large
- The second candle is small
- The second candle forms inside the body of the first candle
The word Harami means pregnant in Japanese, referring to how the smaller candle sits inside the larger candle.
Bullish Harami
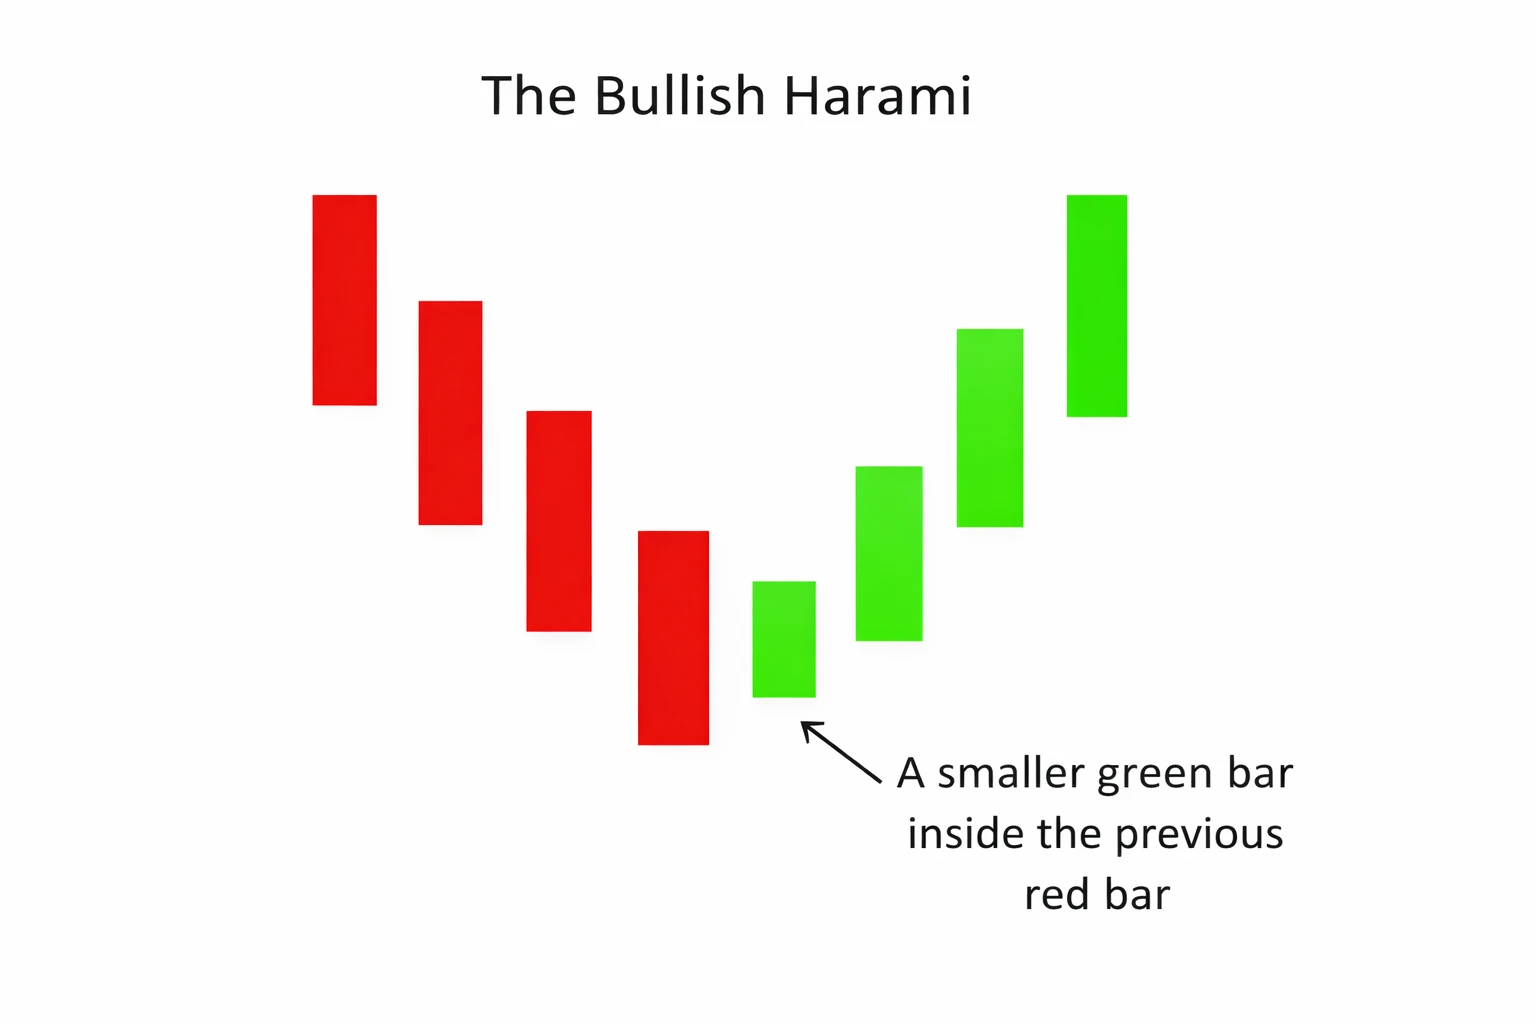
Appears during a downtrend and suggests weakening selling pressure.
Bearish Harami
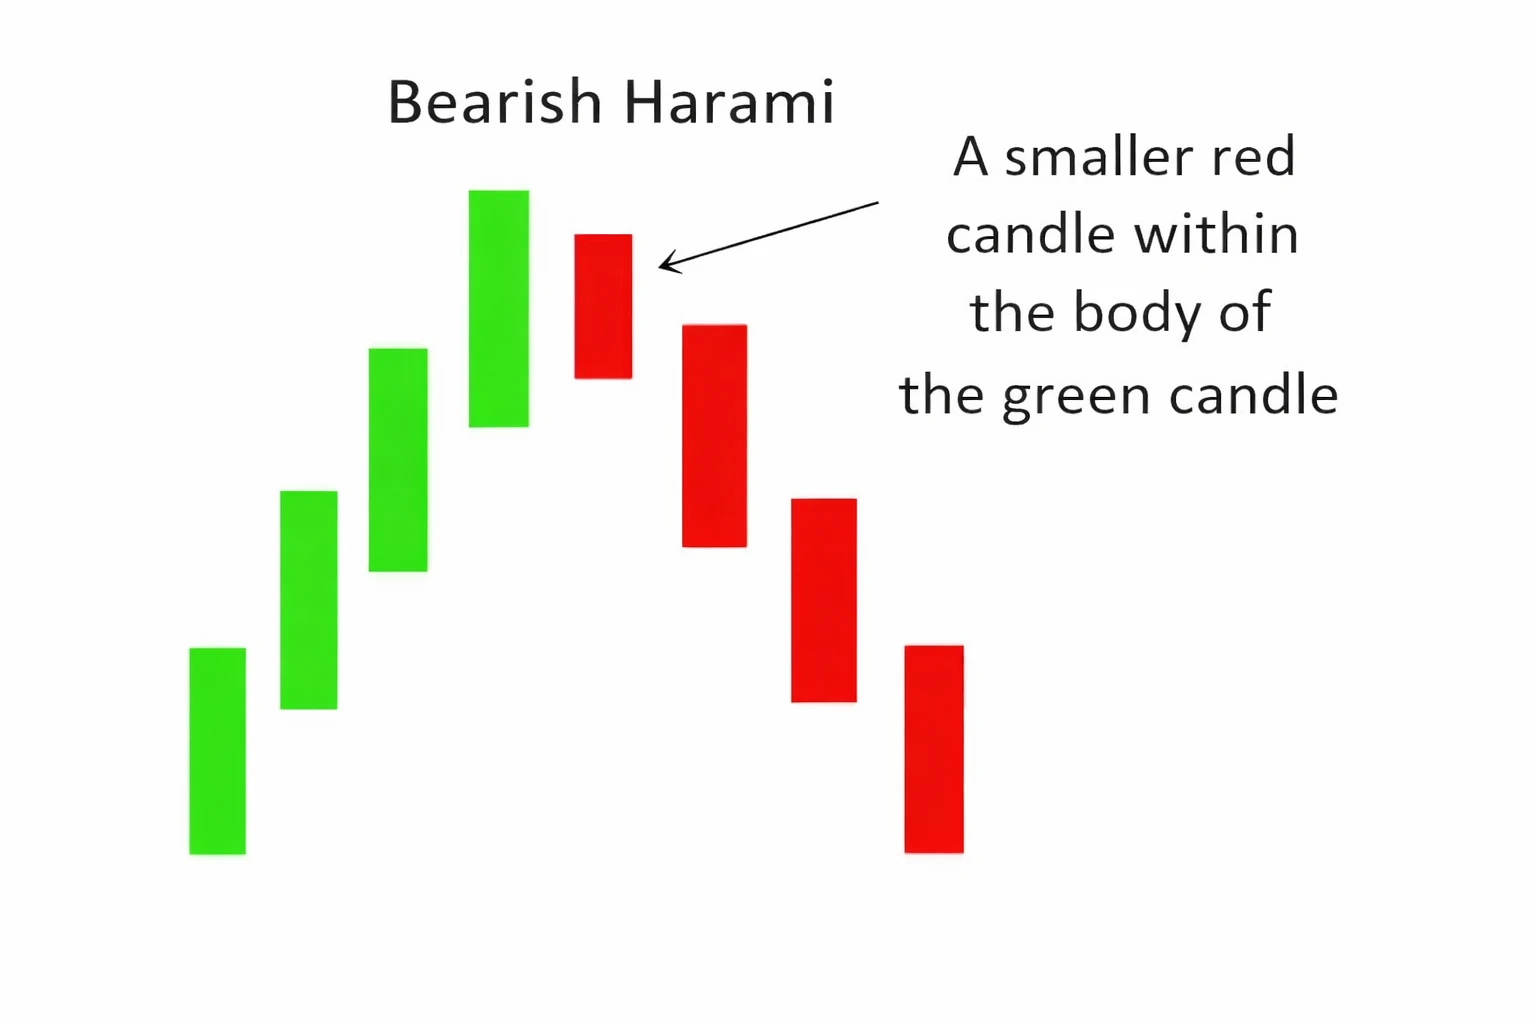
Appears during an uptrend and indicates slowing buying momentum.
Harami patterns often signal indecision in the market, meaning traders should wait for further confirmation.
Gap-Based Candlestick Patterns in Market Sentiment
Gap patterns occur when the market opens significantly higher or lower than the previous closing price.
Gap Up
A gap up occurs when:
- The new candle opens above the previous candle's close
This indicates strong bullish sentiment and aggressive buying pressure.
Gap Down
A gap down occurs when:
- The new candle opens below the previous candle's close
This signals strong bearish sentiment and selling pressure.
Gap patterns are more common in stock markets, but they can also appear in forex markets during major news releases or trading session openings.
Morning Star Candlestick Pattern: Bullish Reversal Structure
The Morning Star pattern is a three-candle formation that signals a potential bullish reversal.
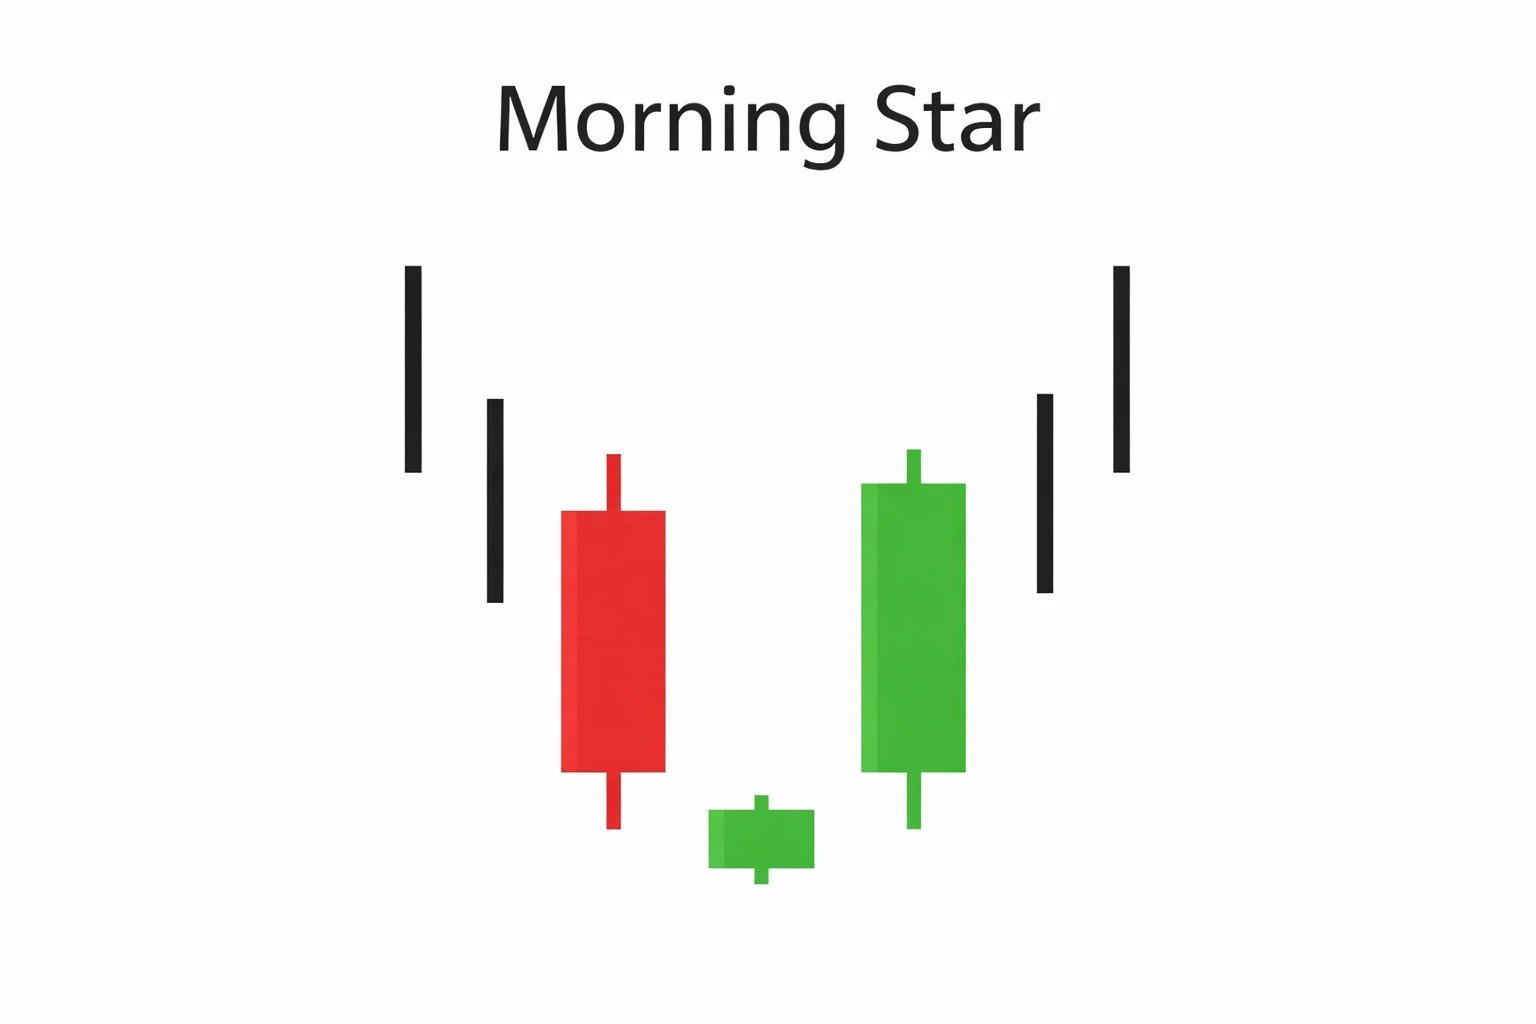
Structure:
- Strong bearish candle
- Small indecision candle
- Strong bullish candle
Market psychology:
- Sellers initially dominate
- Market pauses
- Buyers regain control
This pattern often appears near support zones or demand levels, strengthening its significance.
Evening Star Candlestick Pattern: Bearish Reversal Structure
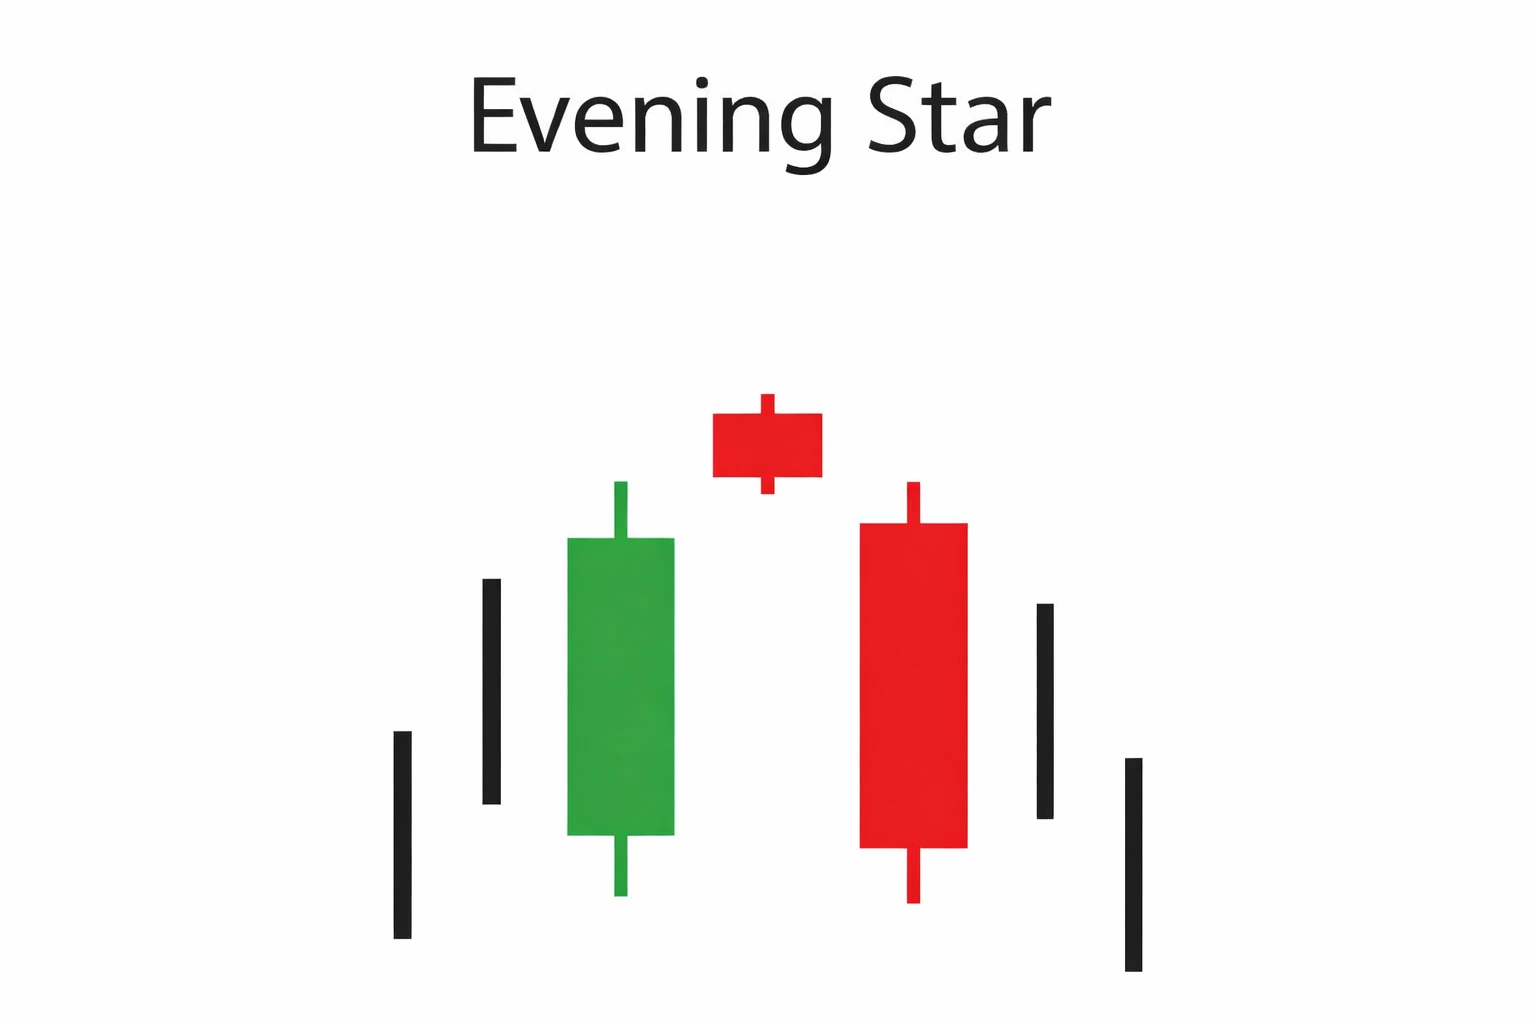
Structure:
- Strong bullish candle
- Small indecision candle
- Strong bearish candle
This pattern indicates that buying momentum is weakening and sellers may take control.
It often forms near resistance levels or supply zones.
Key Lessons Traders Should Learn from Candlestick Patterns
Candlestick patterns provide insights into market psychology and price behavior, but they should not be used as standalone signals.
Important points to remember:
- Candlestick patterns represent buyer and seller interaction
- They provide probability signals, not certainty
- They should always be combined with trend analysis and support/resistance
Professional traders usually combine these patterns with:
- Market structure analysis
- Technical indicators
- Volume analysis
- Risk management strategies
Successful trading requires discipline, patience, and consistent learning.
Conclusion
Multiple candlestick patterns help traders understand potential market reversals, continuation signals, and shifts in market sentiment.
However, these patterns alone are not sufficient to guarantee trading success. They should be used as part of a broader trading framework that includes trend analysis, support and resistance levels, market structure, and proper risk management.
In other words, candlestick patterns are one piece of the larger technical analysis puzzle. For better results, traders should combine them with other tools such as technical indicators, volume analysis, and market context.
This content is intended for educational purposes only and should not be considered financial advice.
FAQ
What are multiple candlestick patterns in trading?
Multiple candlestick patterns are chart formations created by two or three consecutive candles that help traders identify potential trend reversals or market continuation signals.
Are engulfing patterns reliable for trading?
Engulfing patterns can indicate strong shifts in market momentum, but traders usually confirm them with trend direction, support and resistance levels, or indicators.
Can beginners use candlestick patterns in forex trading?
Yes. Candlestick patterns are widely used by both beginners and professional traders because they visually represent market sentiment and price action.
Do candlestick patterns work in all financial markets?
Yes. Candlestick patterns can be applied to forex, stocks, cryptocurrencies, and commodity markets.

Written by
Trade Together Research
Trade Together Research is a professional market analysis team providing forex, gold, and crypto trading insights, technical analysis, and educational guides.. Learn more about our research team on the About page.