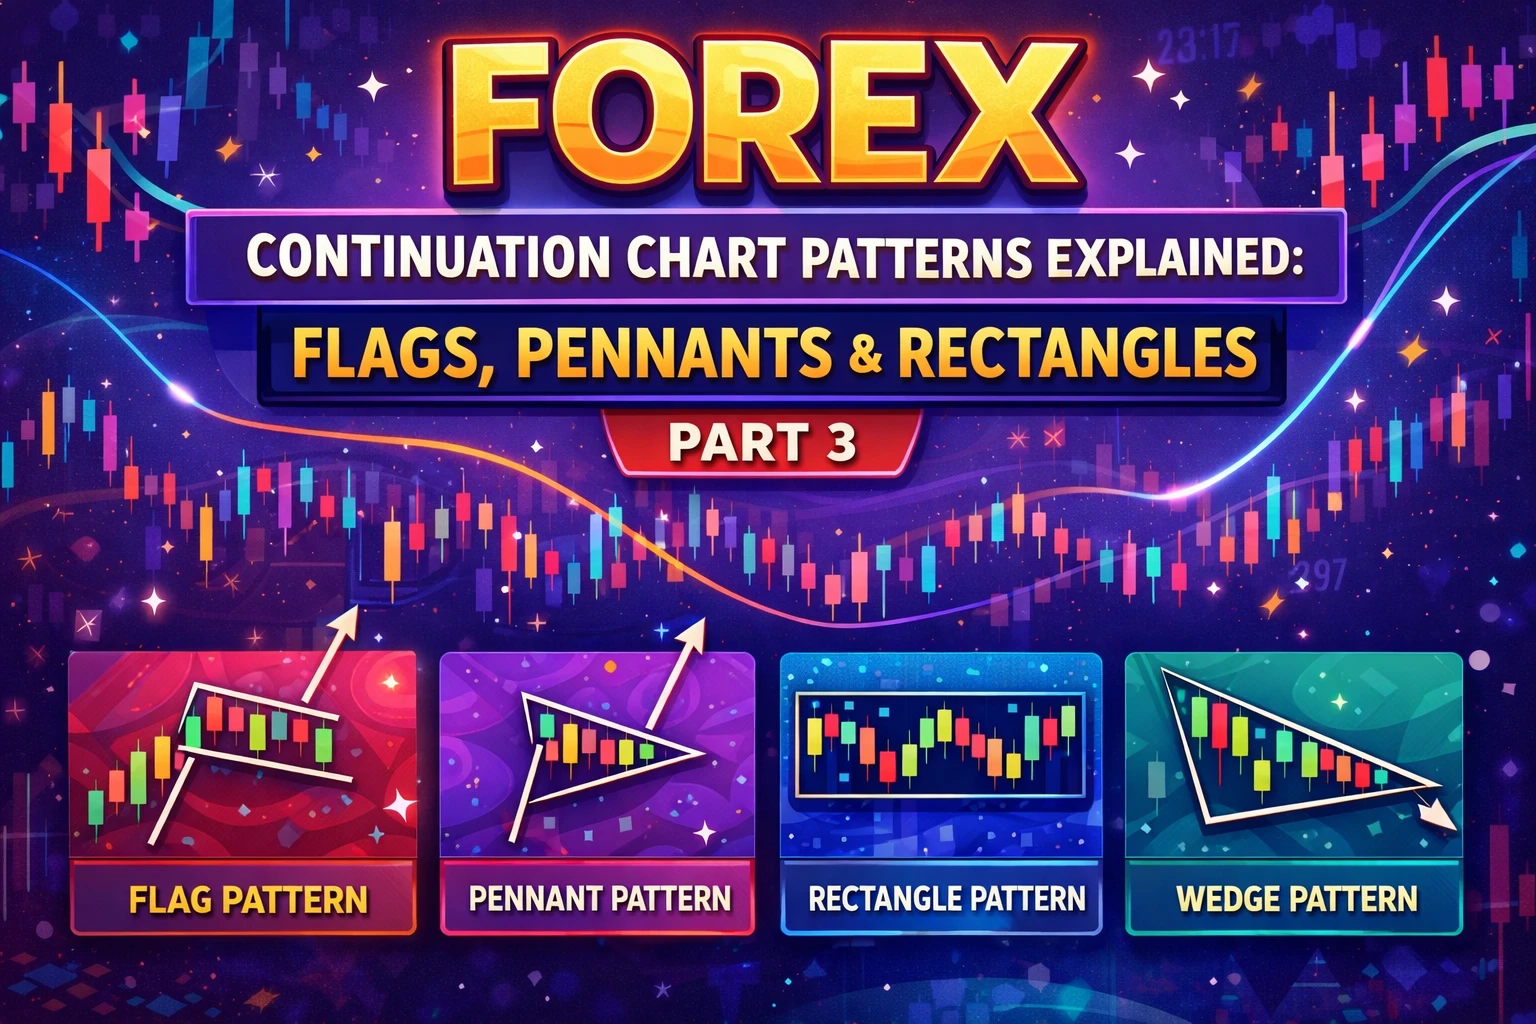
Chapter 20: Forex Continuation Chart Patterns Explained: Flags, Pennants and Rectangles – Part 3
Sat Apr 18 2026
Introduction
In the previous chapters of this price action trading series, we explored the foundations of price action and studied several trend reversal chart patterns that traders use to identify potential turning points in the market.
If you have not read those chapters yet, you can start with the following guides:
Price Action Trading Basics: Chapter 20: Price Action Trading Explained for Forex Beginners (Chart Reading Guide) – Part 1.
Candlestick Patterns Explained:Types of Candlesticks in Trading: Marubozu, Doji, Spinning Top and More — And Their Applications (Chapter 8 – Part 2).
Understanding these earlier concepts is important because chart patterns do not exist in isolation. They appear within the broader context of market structure, trend behavior, and trader psychology.
In price action analysis, chart patterns are generally classified into two major groups:
- Trend Reversal Patterns
- Trend Continuation Patterns
In the previous chapter, we focused on reversal patterns, which may indicate that the current market trend is losing strength and could potentially change direction.
In this chapter, we will focus on the second group: trend continuation chart patterns.
Continuation patterns typically appear when the market temporarily pauses during a strong trend. Instead of reversing direction, the market often consolidates for a short period before continuing in the same direction.
Understanding these patterns can help traders interpret how trends behave during consolidation phases and how momentum may return after a pause.
Trend Continuation Chart Patterns in Price Action Trading
Financial markets rarely move in a straight line. Even during strong trends, price movements often occur in waves consisting of expansion phases and consolidation phases.
A typical trend often follows a repeating cycle:
- Impulse move (strong directional movement)
- Consolidation phase (temporary pause)
- Continuation of the trend
Continuation chart patterns typically appear during the consolidation phase of this cycle.
During consolidation:
- Traders who entered earlier may begin taking profits.
- New participants may enter the market.
- Liquidity builds around important price levels.
- The market temporarily moves within a defined structure.
These temporary pauses often form recognizable patterns such as rectangles, flags, pennants, and wedges.
Understanding these patterns helps traders observe how the market absorbs liquidity before potentially continuing the trend.
However, it is important to remember that chart patterns do not guarantee outcomes. They simply provide a structured way to interpret market behavior.
1. Rectangle Pattern
The Rectangle Pattern is one of the simplest continuation patterns in price action trading.
It forms when price moves sideways between a clearly defined support level and resistance level.
During this period, buyers and sellers temporarily reach a balance, causing price to move within a horizontal range.
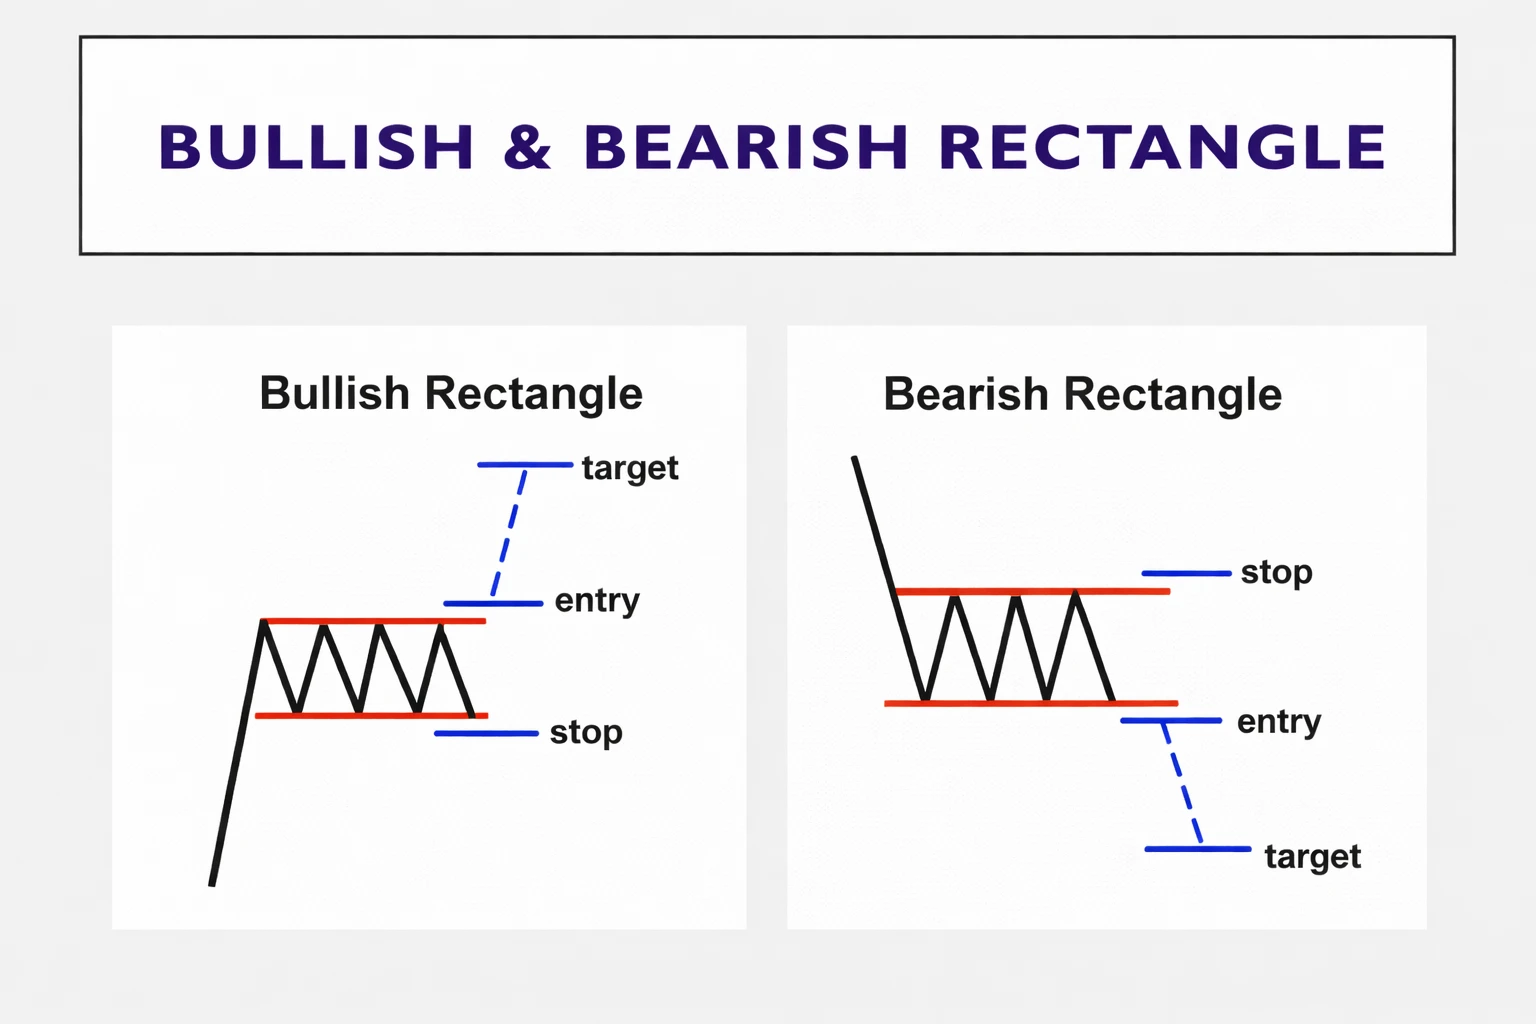
Bullish Rectangle
A bullish rectangle typically appears during an uptrend.
In this situation:
- Price pauses and consolidates within a range.
- Buyers continue defending the support area.
- Sellers temporarily limit upward movement near resistance.
Over time, buyers may gradually absorb selling pressure. If price eventually breaks above the resistance level, the trend may continue upward.
Bearish Rectangle
A bearish rectangle forms during a downtrend.
Here:
- Price consolidates between horizontal levels.
- Sellers maintain control of the market.
- Buyers attempt to push price upward but struggle to break resistance.
If price eventually breaks below the support level, the downward trend may continue.
Rectangles represent a period of market equilibrium, where price temporarily pauses before choosing the next direction.
2. Wedge Pattern in Continuation Context
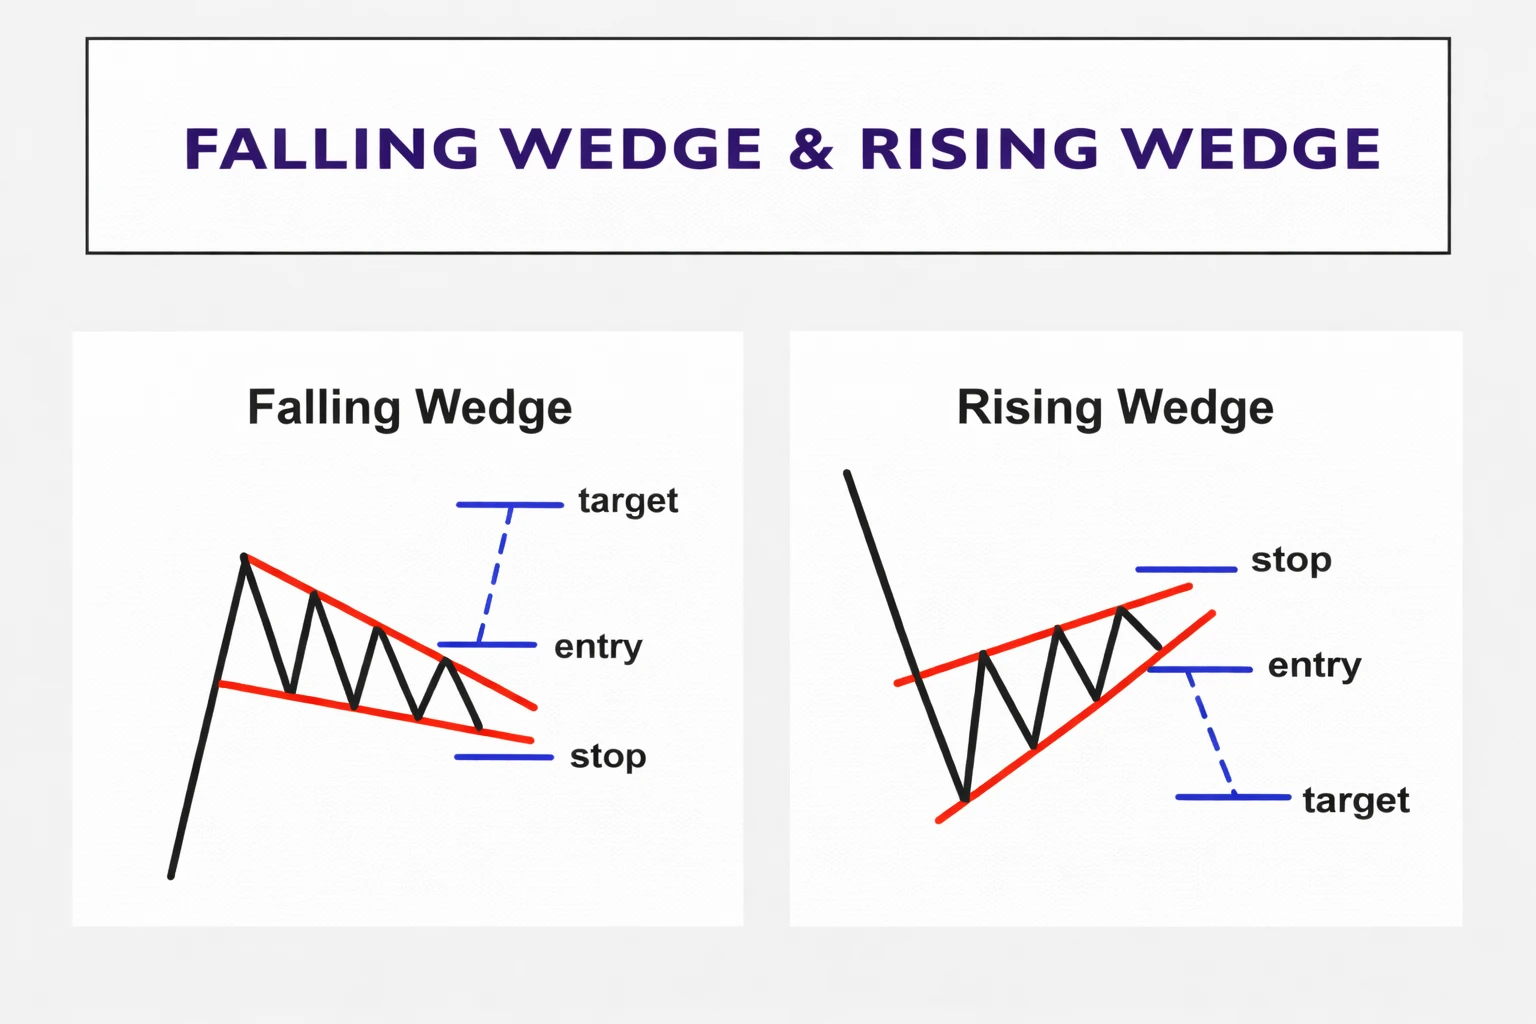
The Wedge Pattern forms when price moves inside two converging trendlines.
Unlike rectangles, wedges show that the market range is gradually becoming narrower over time.
Rising Wedge
A rising wedge forms when price moves upward within converging trendlines.
Although price continues to move higher, the upward momentum may gradually weaken as the range tightens.
In some situations, rising wedges appear as consolidation structures within an uptrend.
Eventually, the market may break out of the wedge pattern and continue the broader trend.
Falling Wedge
A falling wedge forms when price moves downward inside converging trendlines.
During this pattern:
- Price gradually compresses
- Selling pressure may begin to weaken
- The market prepares for the next directional move
Falling wedges sometimes appear during corrective phases within broader trends.
These patterns highlight how markets often compress before expanding again.
3. Pennant Pattern
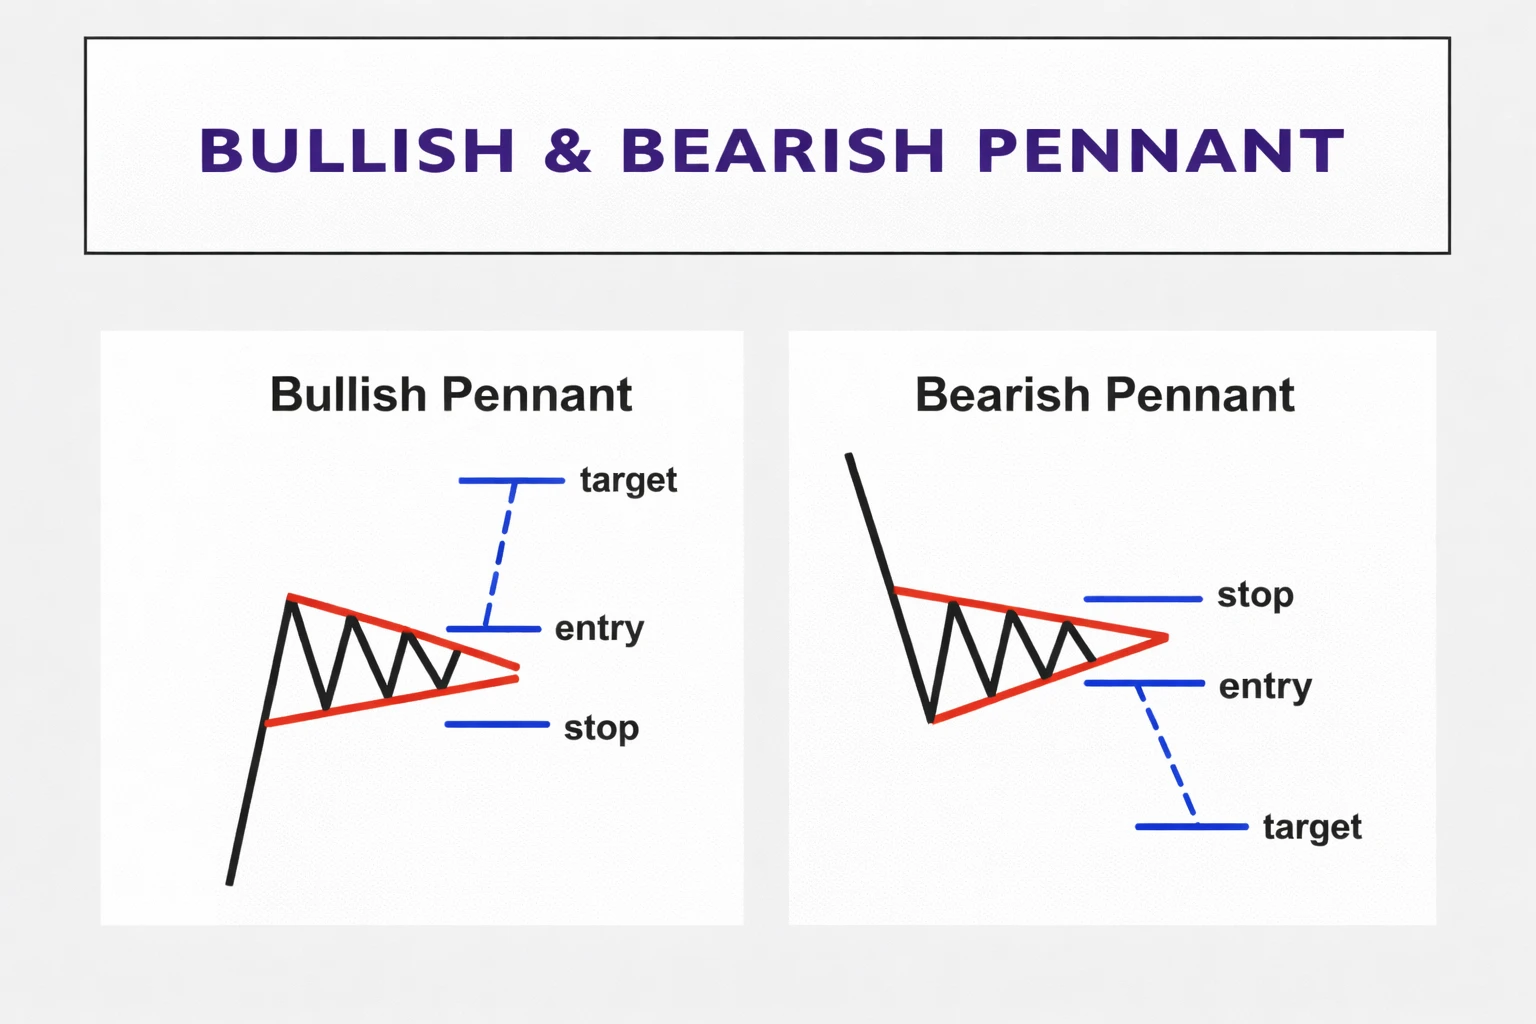
The Pennant Pattern typically forms after a strong and rapid price movement known as an impulse move.
After this initial move, the market enters a short consolidation phase where price forms a small symmetrical structure resembling a triangle.
Pennants generally have three main characteristics:
- A strong impulse move
- A brief consolidation period
- A potential continuation of the original trend
This pattern reflects a moment where traders temporarily pause before deciding whether to continue pushing the market in the same direction.
Pennants are often observed in highly active markets where strong momentum is followed by short consolidation periods.
4. Flag Pattern
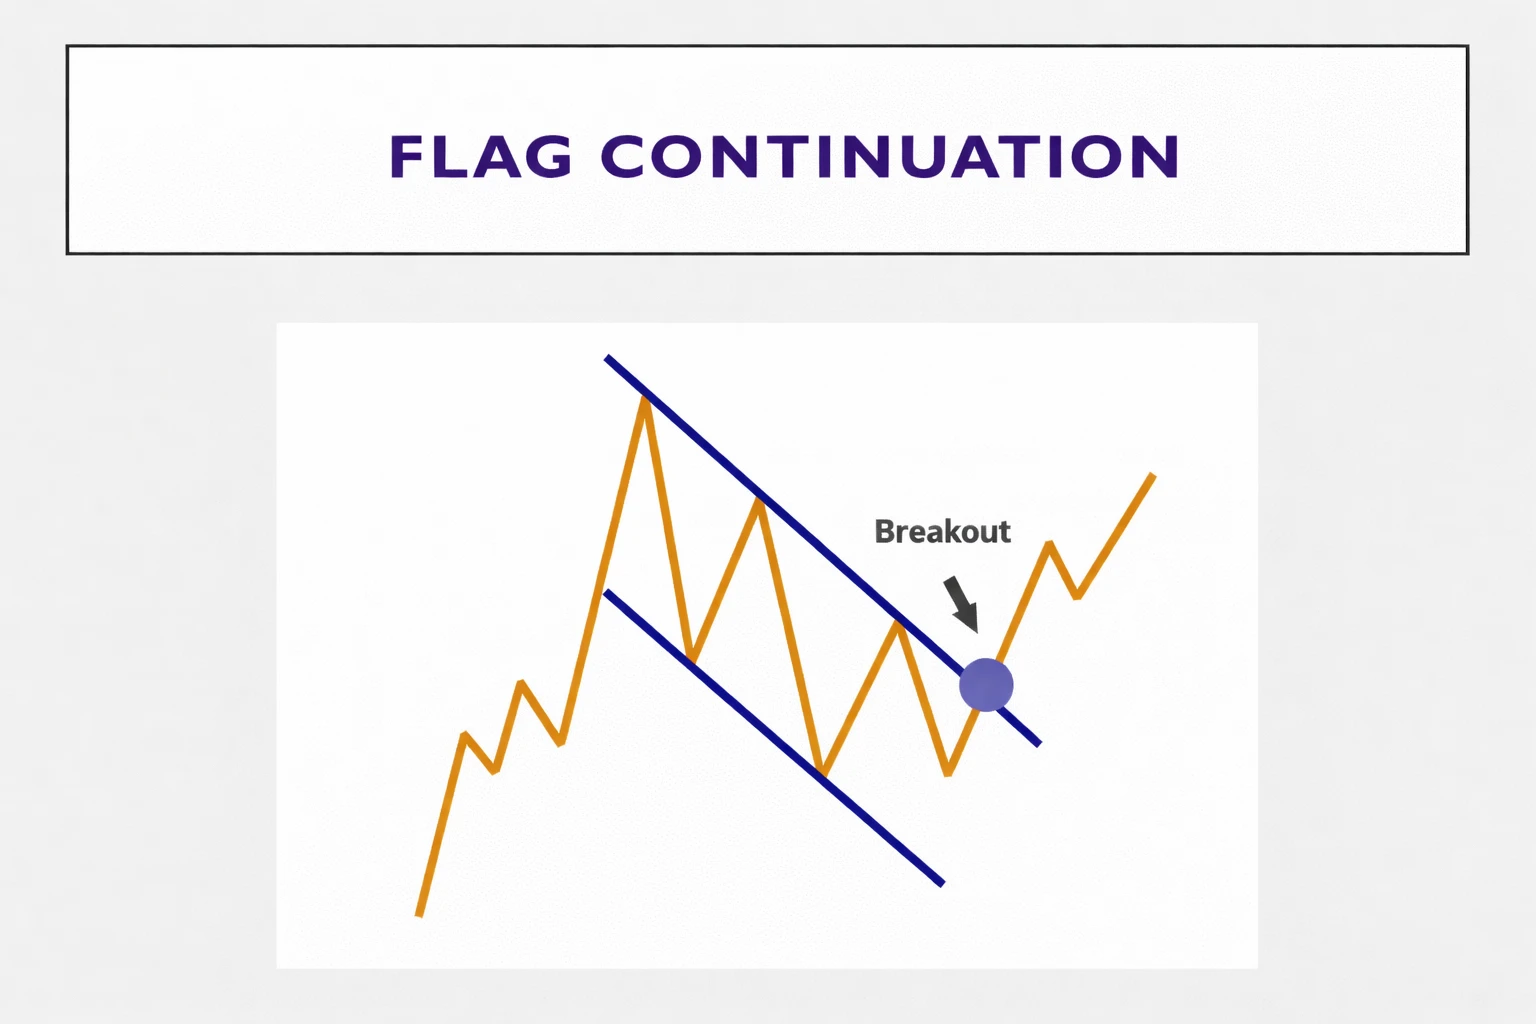
The Flag Pattern is another commonly observed continuation pattern.
It typically forms after a strong directional price movement.
Instead of moving sideways like rectangles, price consolidates in a small channel that slopes slightly against the main trend.
Bullish Flag
A bullish flag forms after a strong upward move.
Following the impulse move:
- Price retraces slightly downward
- A small downward channel forms
- Buyers may eventually regain control
When price breaks out of the consolidation channel, the upward trend may resume.
Bearish Flag
A bearish flag forms after a strong downward move.
In this case:
- Price temporarily retraces upward
- A small upward channel appears
- Sellers may regain control after the consolidation phase
Flags illustrate how markets often pause briefly before continuing strong trends.
Continuation vs Reversal Patterns
One challenge that many beginner traders face is distinguishing between continuation patterns and reversal patterns.
In some situations, the same price structure may behave differently depending on the market context.
For example:
- A wedge pattern may act as a continuation pattern during a strong trend.
- The same wedge may behave as a reversal pattern if the trend is losing momentum.
Because of this, traders often consider additional factors when interpreting chart patterns:
- Trend strength
- Market structure
- Support and resistance levels
- Liquidity zones
Understanding the broader context helps traders avoid misinterpreting patterns.
Price action analysis is not about memorizing shapes on charts. Instead, it is about understanding how buyers and sellers interact at important price levels.
Practice Exercise for Beginners
The best way to understand continuation patterns is through practical observation.
Open a charting platform and try to identify continuation patterns on instruments such as:
- EUR/USD
- GBP/USD
- Gold
- Major stock indices
Try to locate examples of:
- Rectangles
- Flags
- Pennants
- Wedges
Observe how price behaves before and after these patterns form.
This exercise helps traders develop a better understanding of market structure and price behavior.
If you encounter any difficulties while identifying patterns, feel free to ask your questions in the comment section, and we will try to respond.
Conclusion
Continuation chart patterns are an important part of price action analysis because they help traders understand how trends behave during consolidation phases.
Patterns such as rectangles, wedges, flags, and pennants represent periods where price temporarily pauses while the market gathers momentum for the next movement.
However, no chart pattern guarantees a specific outcome. Financial markets are influenced by many factors including liquidity conditions, macroeconomic events, volatility changes, and trader psychology.
For this reason, traders should always approach chart patterns with discipline, probability-based thinking, and proper risk management.
This article is intended for educational purposes only and should not be considered financial advice.
In the next chapter, we will explore additional concepts that help traders better understand how continuation patterns behave in real market conditions.
Frequently Asked Questions
What are continuation chart patterns in forex trading?
Continuation chart patterns are price structures that appear during temporary pauses within a trend and suggest that the trend may continue afterward.
Are flag and pennant patterns reliable?
These patterns can provide useful insights into market behavior, but they should always be analyzed alongside trend context and proper risk management.
How do traders confirm continuation patterns?
Many traders wait for price to break out of the consolidation structure and confirm the direction before interpreting continuation patterns.
What is the difference between continuation and reversal patterns?
Continuation patterns suggest that the existing trend may resume, while reversal patterns indicate that a trend may change direction.

Written by
Trade Together Research
Trade Together Research is a professional market analysis team providing forex, gold, and crypto trading insights, technical analysis, and educational guides.. Learn more about our research team on the About page.