Chapter 14: Forex Technical Indicators Explained for Beginners: Types, Leading vs Lagging Indicators
Mon Mar 23 2026

Introduction
In the previous chapters, we explored some of the most important foundations of technical analysis, such as trend analysis and support and resistance levels.
Trend analysis helps traders understand the general direction of the market — whether the market is moving upward, downward, or sideways. If you want to review that concept again, you can read our detailed guide on https://tradetogether.in/articles/forex-trading-step-by-step-trend-support-resistance, where we explained how traders identify trends and combine them with support and resistance levels.
Support and resistance levels represent important price areas where the market previously reacted. These levels help traders identify potential zones where buyers or sellers may become active again.
However, many traders also use technical indicators to gain additional insight into market behavior. Indicators help traders analyze things such as:
- Market trend
- Momentum of price movement
- Volatility
- Trading volume
In this chapter, we will understand what trading indicators are, why traders use them, and the different types of indicators used in technical analysis.
What Is an Indicator?
In simple terms, an indicator is something that provides information or signals about a situation.
For example:
- A fuel indicator in a car shows how much fuel remains.
- A temperature indicator tells us whether the environment is hot or cold.
- A battery indicator shows the remaining charge of a device.
These indicators do not change the situation itself. Instead, they help us understand the current condition so that we can make better decisions.
What Are Trading Indicators?
In financial markets, trading indicators are mathematical calculations based on market data such as:
- Price
- Time
- Volume
These calculations are plotted on a chart to help traders interpret market behavior more clearly. Technical indicators analyze historical price data and transform it into visual signals that help traders identify trends, momentum, volatility, or potential market turning points.
Indicators do not predict the future with certainty. Instead, they help traders interpret probabilities and make more informed trading decisions.
Why Traders Use Technical Indicators
Many traders use indicators because they help simplify complex market information.
Some common reasons traders use indicators include:
1. Identifying Trends
Indicators such as moving averages help traders understand whether the market is trending upward or downward.
2. Measuring Momentum
Momentum indicators measure the speed of price movement and help traders understand whether buyers or sellers are gaining strength.
3. Measuring Volatility
Volatility indicators measure how much price fluctuates. For example, Bollinger Bands show how much price deviates from its average and help identify periods of high or low volatility.
4. Confirming Trading Analysis
Many traders combine indicators with price action, support and resistance, and market structure to confirm their analysis.
For example, traders may confirm their analysis using volume behavior. If you want to learn more about this, you can read our guide on https://tradetogether.in/articles/tick-volume-forex-trading-beginners-guide.
Types of Technical Indicators
Technical indicators can be categorized in several ways. In this chapter, we will understand them using three simple classifications.
1. Based on Where They Are Plotted
Indicators can appear directly on the price chart or below the chart in a separate window.
Overlays
Overlay indicators are plotted directly on the price chart and use the same scale as the price.
Common examples include:
- Moving Averages
- Bollinger Bands
These indicators help traders analyze price movement relative to the indicator itself.
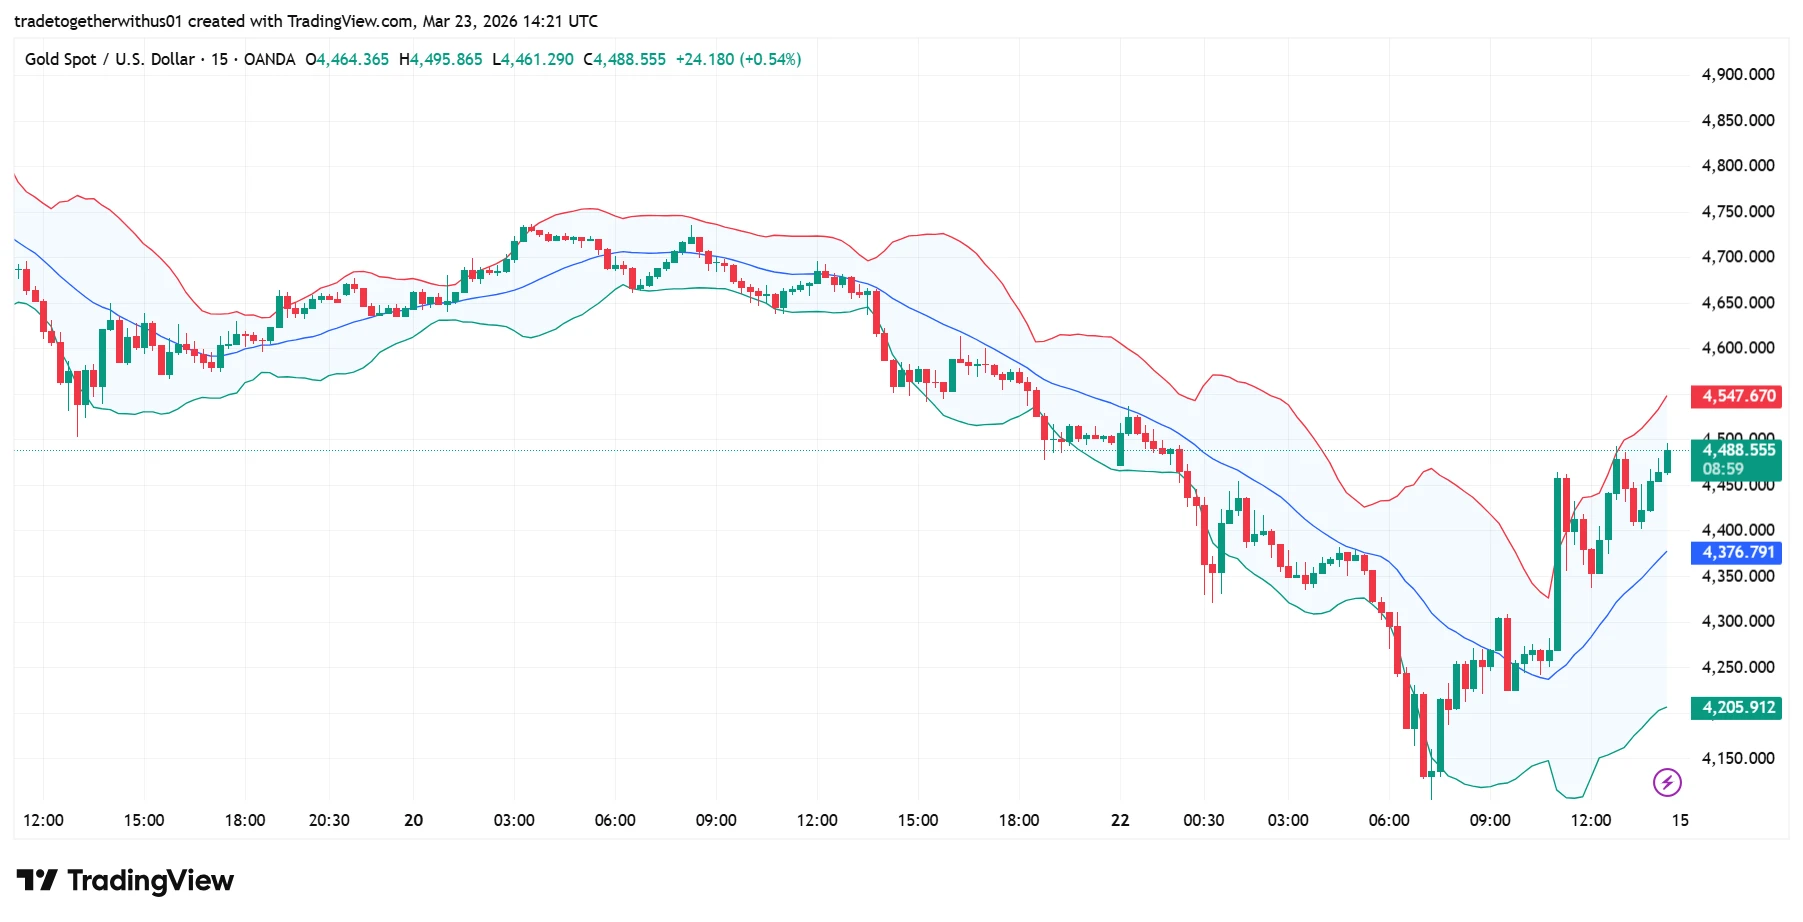
As you can see in the image above, Bollinger Bands appear directly on the price chart. The bands expand and contract depending on market volatility and help traders understand whether price is relatively high or low compared to its average.
Oscillators
Oscillators are plotted above or below the price chart in a separate panel.
They typically move between specific levels and help traders identify momentum or overbought/oversold conditions.
Examples include:
- RSI (Relative Strength Index)
- MACD
- Stochastic Oscillator
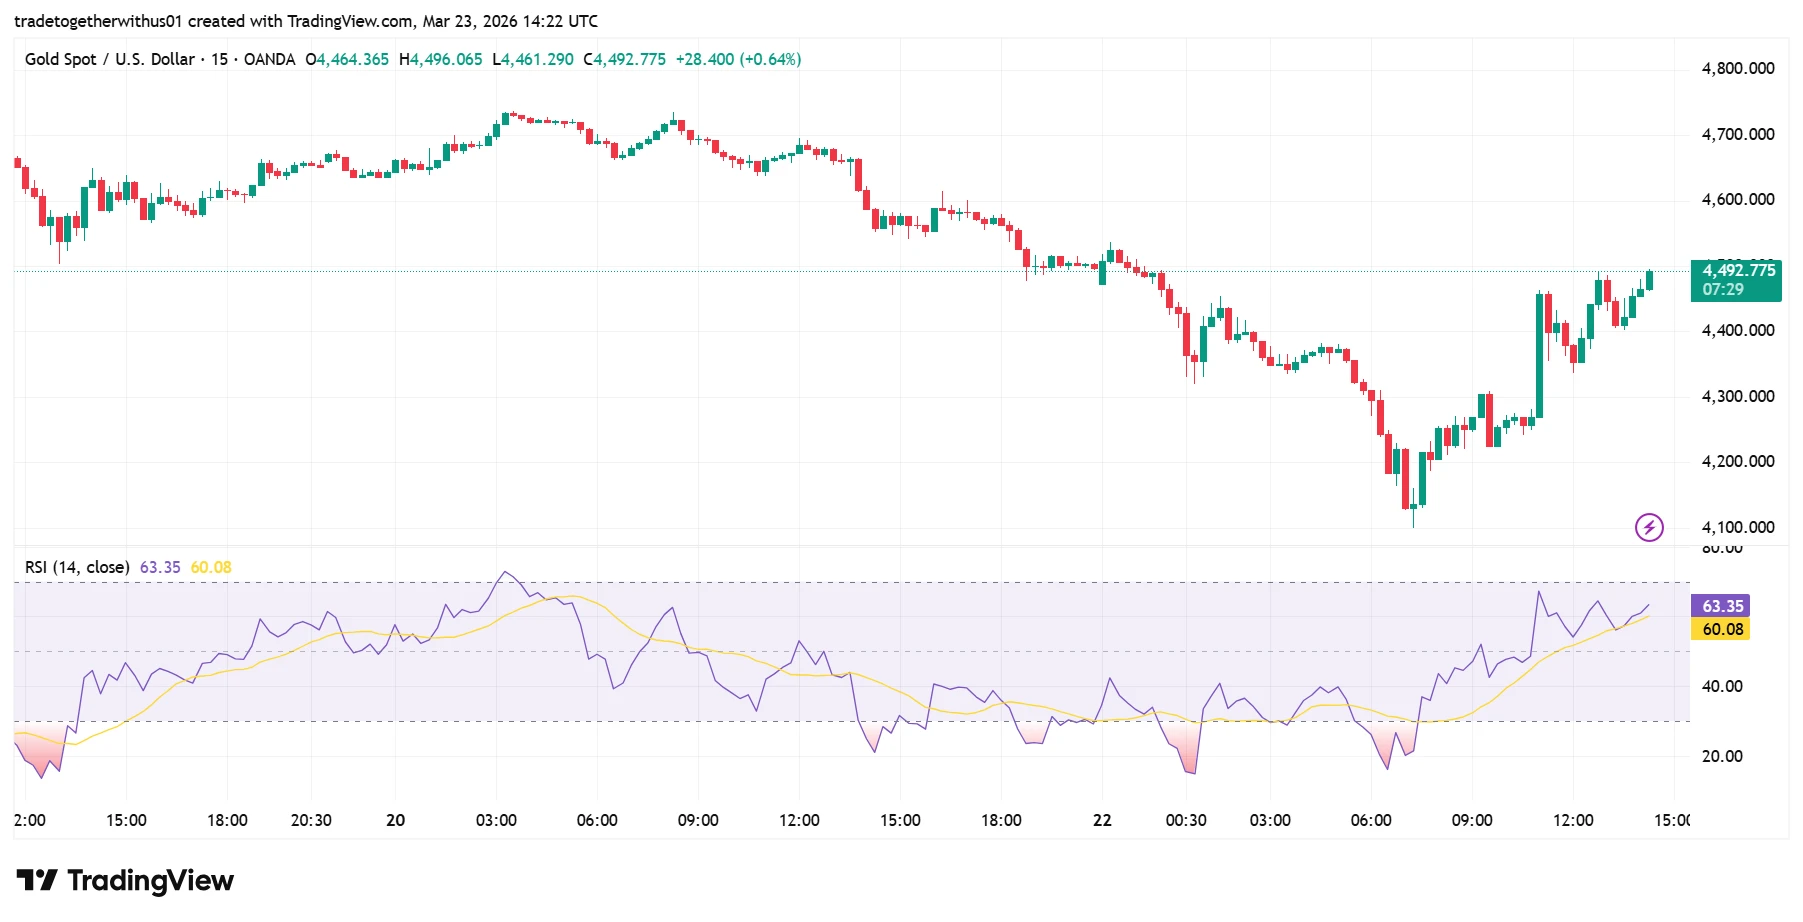
As you can see in the image above, the RSI indicator appears below the price chart. RSI moves between 0 and 100 and helps traders identify potential overbought or oversold conditions in the market.
2. Based on When They Indicate
Indicators can also be classified depending on when they provide signals.
Lagging Indicators
Lagging indicators follow price movement and provide signals after a trend or reversal has already started.
They are mainly used to confirm the direction and strength of an existing trend.
Examples:
- Moving Averages
- Bollinger Bands
Lagging indicators help traders filter market noise and confirm longer-term trends.
Leading Indicators
Leading indicators attempt to provide signals before a trend begins.
They are used to identify potential early market opportunities or reversals.
Examples include:
- RSI
- MACD
- Stochastic Oscillator
However, leading indicators can sometimes produce false signals, so traders usually combine them with other tools.
3. Based on What They Indicate
Indicators can also be classified according to what type of market information they provide.
Trend Indicators
Trend indicators help measure the direction and strength of a market trend.
Examples:
- Moving Averages
- MACD
- Parabolic SAR
Momentum Indicators
Momentum indicators measure how quickly the price is moving compared to the past. Examples:
- RSI
- Stochastic Oscillator
These indicators help traders evaluate whether momentum is increasing or decreasing.
Volatility Indicators
Volatility indicators measure how much price fluctuates during a certain period.
Examples:
- ATR (Average True Range)
- Bollinger Bands
Volume Indicators
Volume indicators measure the trading activity and participation in the market.
Examples:
- Volume Chart
- OBV (On Balance Volume)
Increasing volume often confirms stronger market movements.
Things to Keep in Mind When Using Indicators
Before using indicators, traders should remember several important points.
- There is no perfect indicator.
- Avoid overusing indicators. It is better to select 2–4 indicators and study them deeply.
- Indicators may not work equally well in all markets or instruments.
- Experience is essential in understanding how indicators behave.
- The more charts you study, the more patterns you will recognize.
- Be patient and focus on continuous learning.
- After learning the basics, try to develop your own analysis method rather than blindly following trading tips or signals.
Successful trading requires discipline, patience, and consistent learning. Developing the right mindset is just as important as learning technical tools or indicators. Many traders struggle not because of a lack of knowledge, but because of emotional decisions and lack of discipline. If you want to understand this deeper, you can explore our Trader Psychology learning series here: https://tradetogether.in/readlists/trader-psychology-series.
Conclusion
Technical indicators are powerful tools that help traders analyze financial markets more effectively. They transform historical price data into visual signals that assist traders in understanding trends, momentum, volatility, and market participation.
However, indicators should always be used as supporting tools rather than standalone trading systems. The most effective trading approaches usually combine:
- Market structure analysis
- Support and resistance levels
- Trend analysis
- Risk management
Financial markets operate within probabilities, not certainty. Therefore, traders must always approach trading with discipline, risk management, and a continuous learning mindset.
This content is provided for educational purposes only and should not be considered financial advice.
FAQ
Are technical indicators necessary for trading?
No. Some traders rely primarily on price action and market structure. Indicators simply provide additional analytical insights.
How many indicators should beginners use?
Beginners should start with two to four indicators to avoid confusion and focus on understanding them deeply.
Are indicators always accurate?
No indicator is perfect. Indicators only help interpret market conditions and should be combined with other analysis methods.
Can indicators predict the market?
Indicators do not predict the future. They analyze past price behavior to help traders estimate possible market scenarios.

Written by
Trade Together Research
Trade Together Research is a professional market analysis team providing forex, gold, and crypto trading insights, technical analysis, and educational guides.. Learn more about our research team on the About page.