Chapter 12: How to Take a Trade Using Trend, Support & Resistance and Candlestick Confirmation
Sat Mar 21 2026
Introduction
In the previous chapters, we studied several important concepts that help traders understand how financial markets behave.
We first learned how to read candlestick charts and understand what different candles represent. If you have not studied this yet, you can read our detailed guide on candlestick patterns and types explained.
Then we studied how to identify the overall market direction using trend analysis. Understanding trends helps traders know whether the market is generally moving upward, downward, or sideways. You can review that concept here: trend analysis in forex (uptrend, downtrend & sideways).
After that, we learned how to identify important price levels where markets often react, which are known as support and resistance levels. These levels represent areas where buyers or sellers previously showed strong interest. You can review that chapter here: support and resistance levels explained for beginners.
However, understanding these concepts individually is only the first step.
The next important question many beginners ask is:
How do we combine these concepts to take a real trade in the market?
In this chapter, we will learn a simple and structured approach that combines:
- Market trend
- Support and resistance
- Candlestick confirmation
This example will help you understand how traders analyze the market step-by-step before entering a trade.
Trading Procedure Overview
Before we go into the practical example, let us first understand the simple process we will follow.
Step 1 — Identify the Market Trend
First, determine the overall direction of the market. Trading with the trend generally provides higher probability setups compared to trading against it.
Step 2 — Identify Support and Resistance
Next, mark important price levels where the market previously reacted.
These areas often act as decision zones where buyers or sellers become active.
Step 3 — Wait for Price Confirmation
Finally, wait for a price action signal, such as a rejection candle, before entering the trade.
This confirmation helps traders avoid entering the market too early.
Step 1: Identify the Market Trend
Now let us look at a real market example.
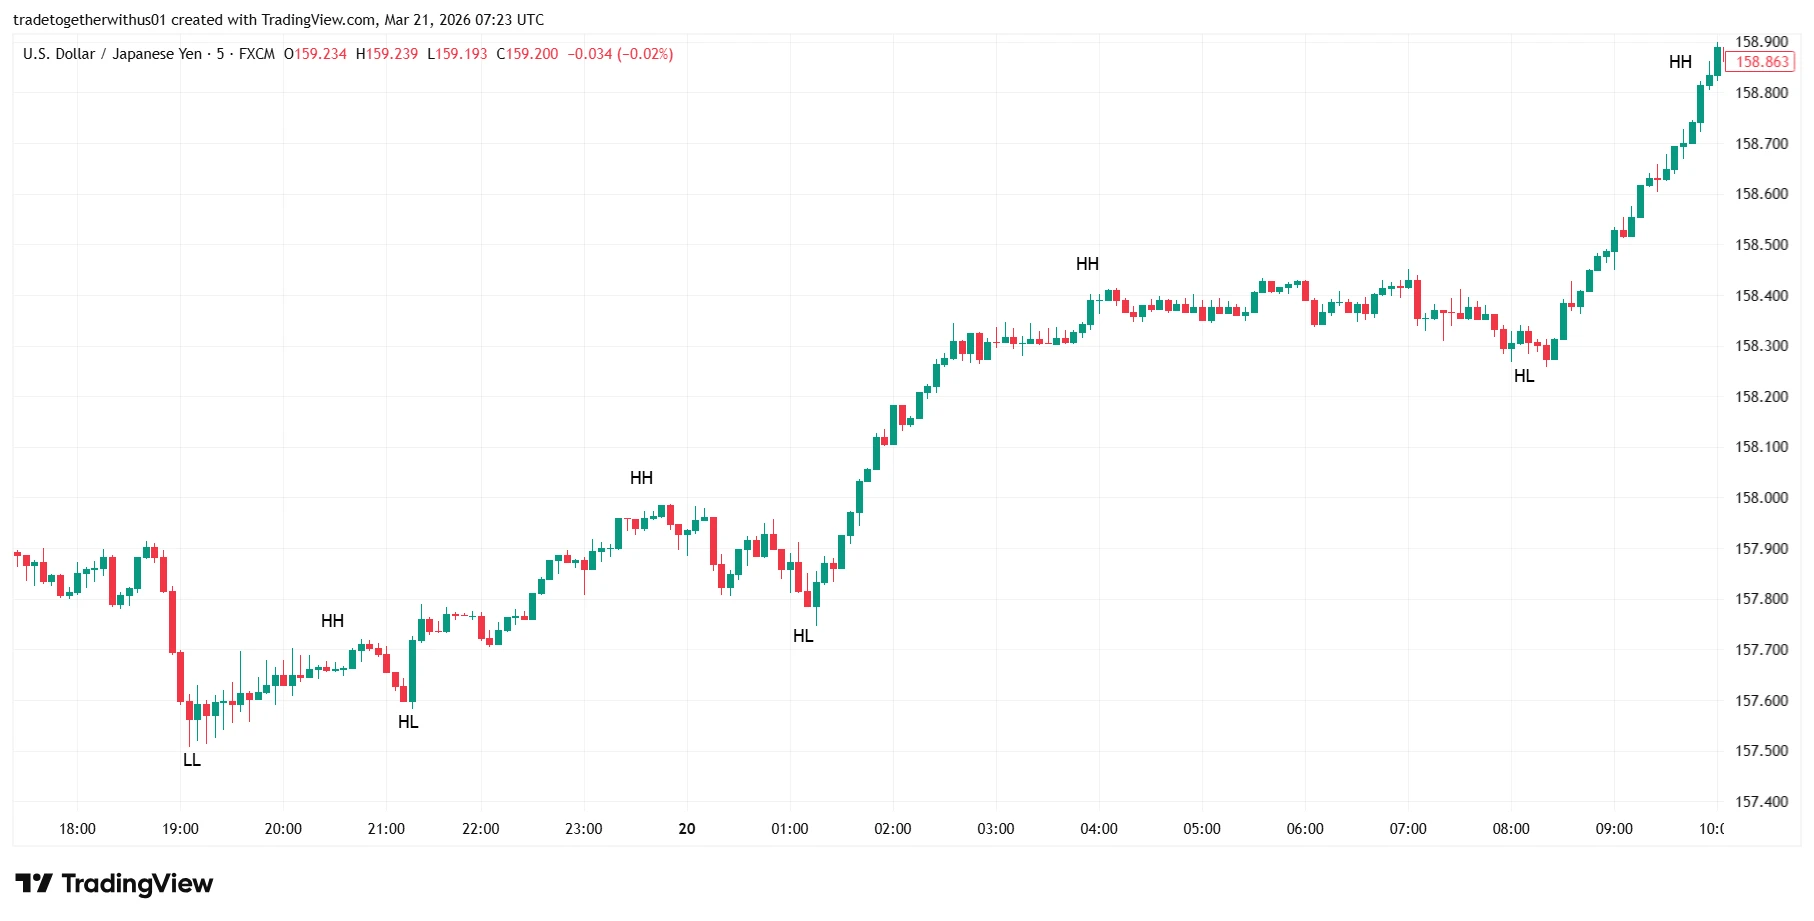
For this demonstration, we are analyzing the USDJPY chart on the 5-minute timeframe.
When we observe the chart carefully, we can see that the market structure is forming a sequence of:
- Higher highs
- Higher lows
This pattern indicates that the market is currently in an uptrend.
In real trading environments, trends will not always appear perfectly structured or easy to recognize. Price movements can look messy or irregular, and sometimes traders need practice to clearly identify the trend.
With experience, traders learn to observe the overall market structure rather than expecting perfectly shaped patterns.
Since the market is showing an uptrend, we focus only on buy opportunities.
We avoid looking for sell trades because trading against the dominant trend often reduces the probability of success.
Key Learning
- Always identify the overall market trend first.
- Trading with the trend usually provides higher probability setups.
- Beginners should avoid trading against strong trends.
Step 2: Identify the Support and Resistance Area
Next, we identify an important support level.
For beginners, identifying support and resistance on a candlestick chart can sometimes be confusing because candlestick charts contain:
- Candle bodies
- Upper wicks
- Lower wicks
These elements can create visual noise.
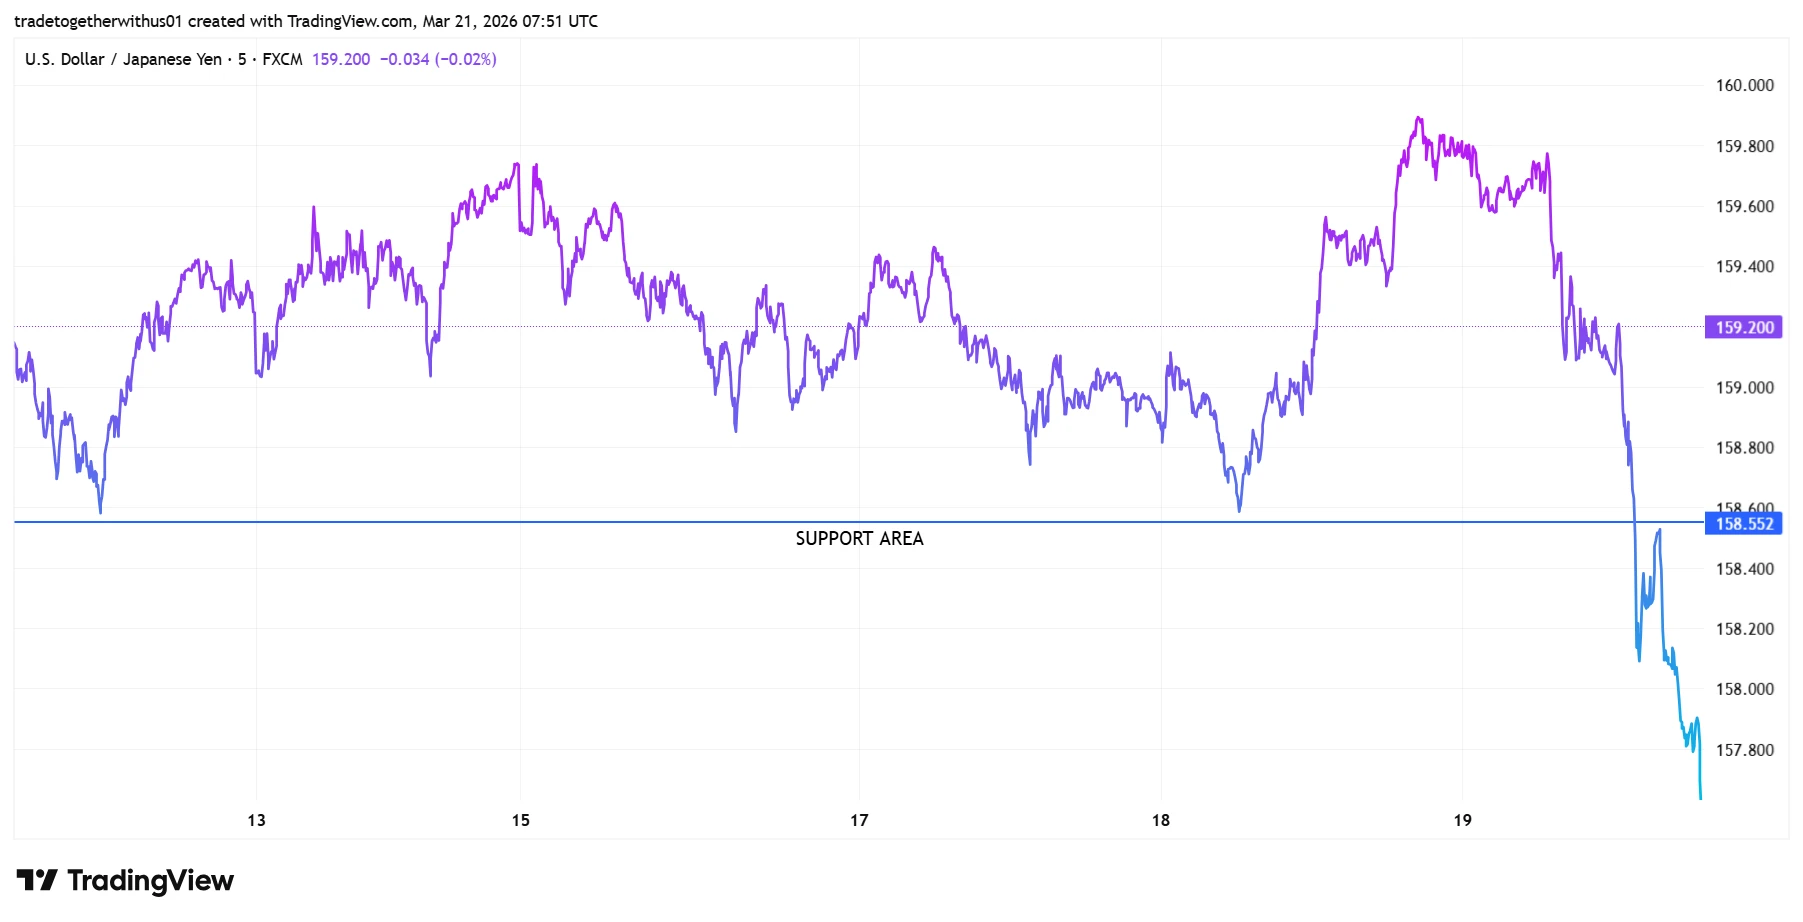
Because of this, beginners can temporarily switch to a line chart.
A line chart connects only the closing prices, which removes unnecessary price spikes and makes it easier to identify where the market repeatedly reacts.
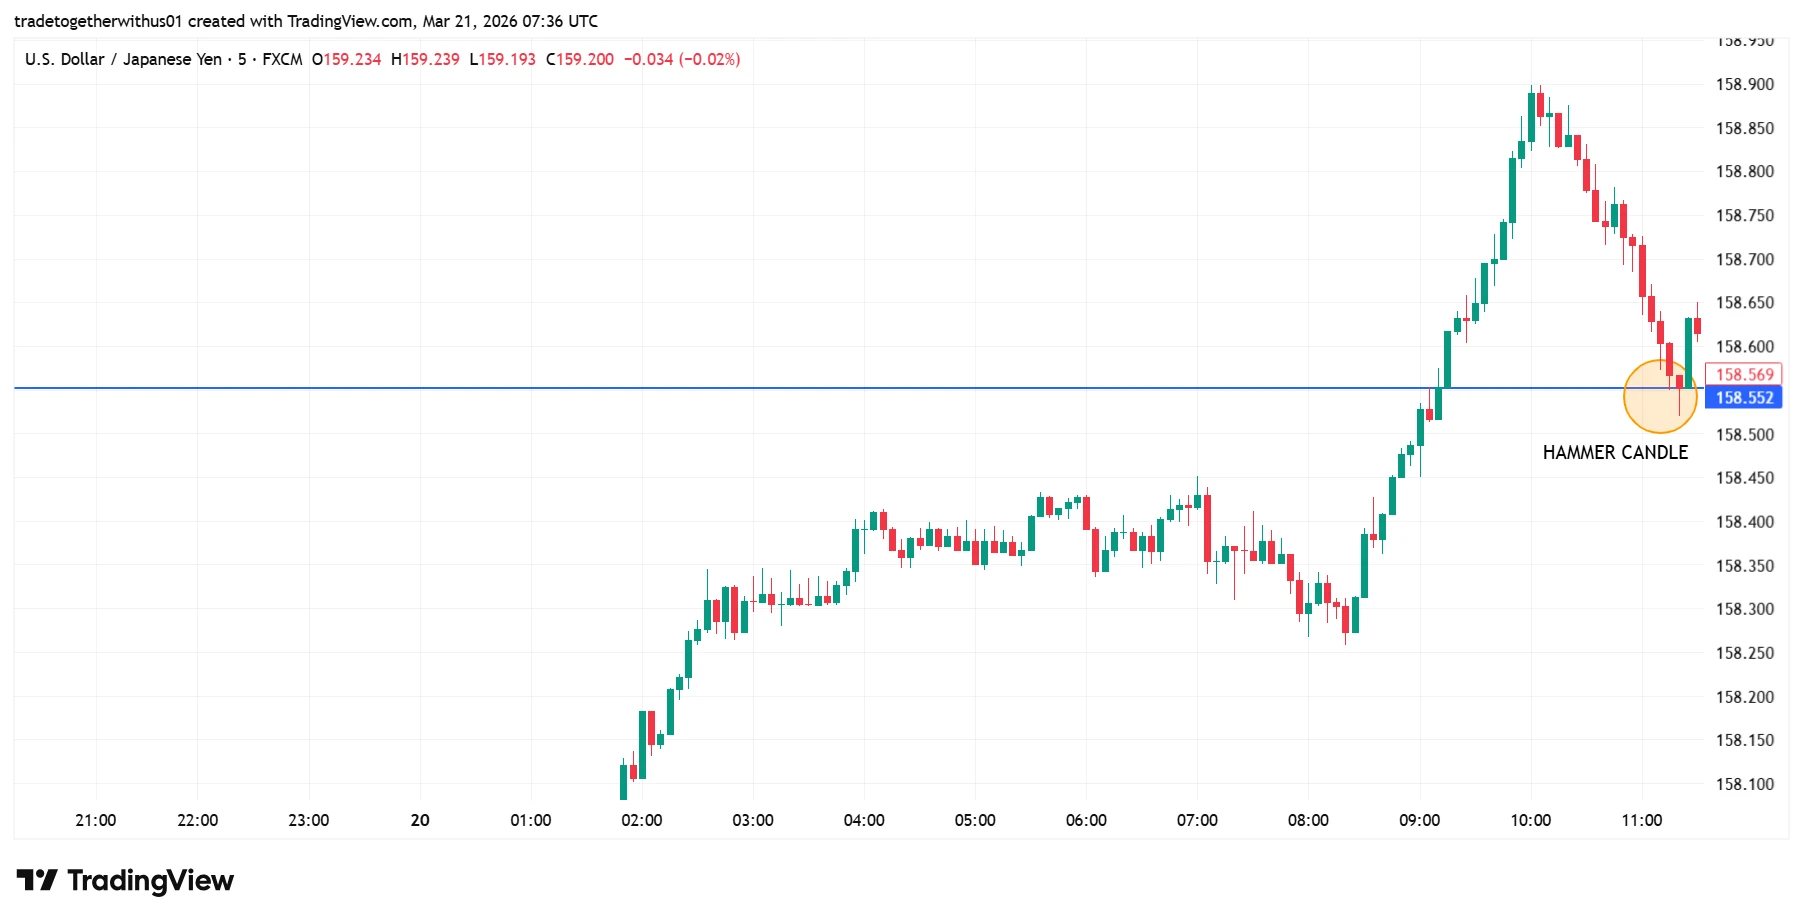
If we zoom out slightly on the USDJPY chart, we can see that price has repeatedly reacted around the level 158.552.
This level acts as a support area where buyers previously entered the market.
When traders observe multiple reactions at the same level, it indicates that the price zone has importance in market structure and liquidity behavior.
Once beginners become comfortable identifying these levels on a line chart, they can move back to the candlestick chart for more detailed analysis.
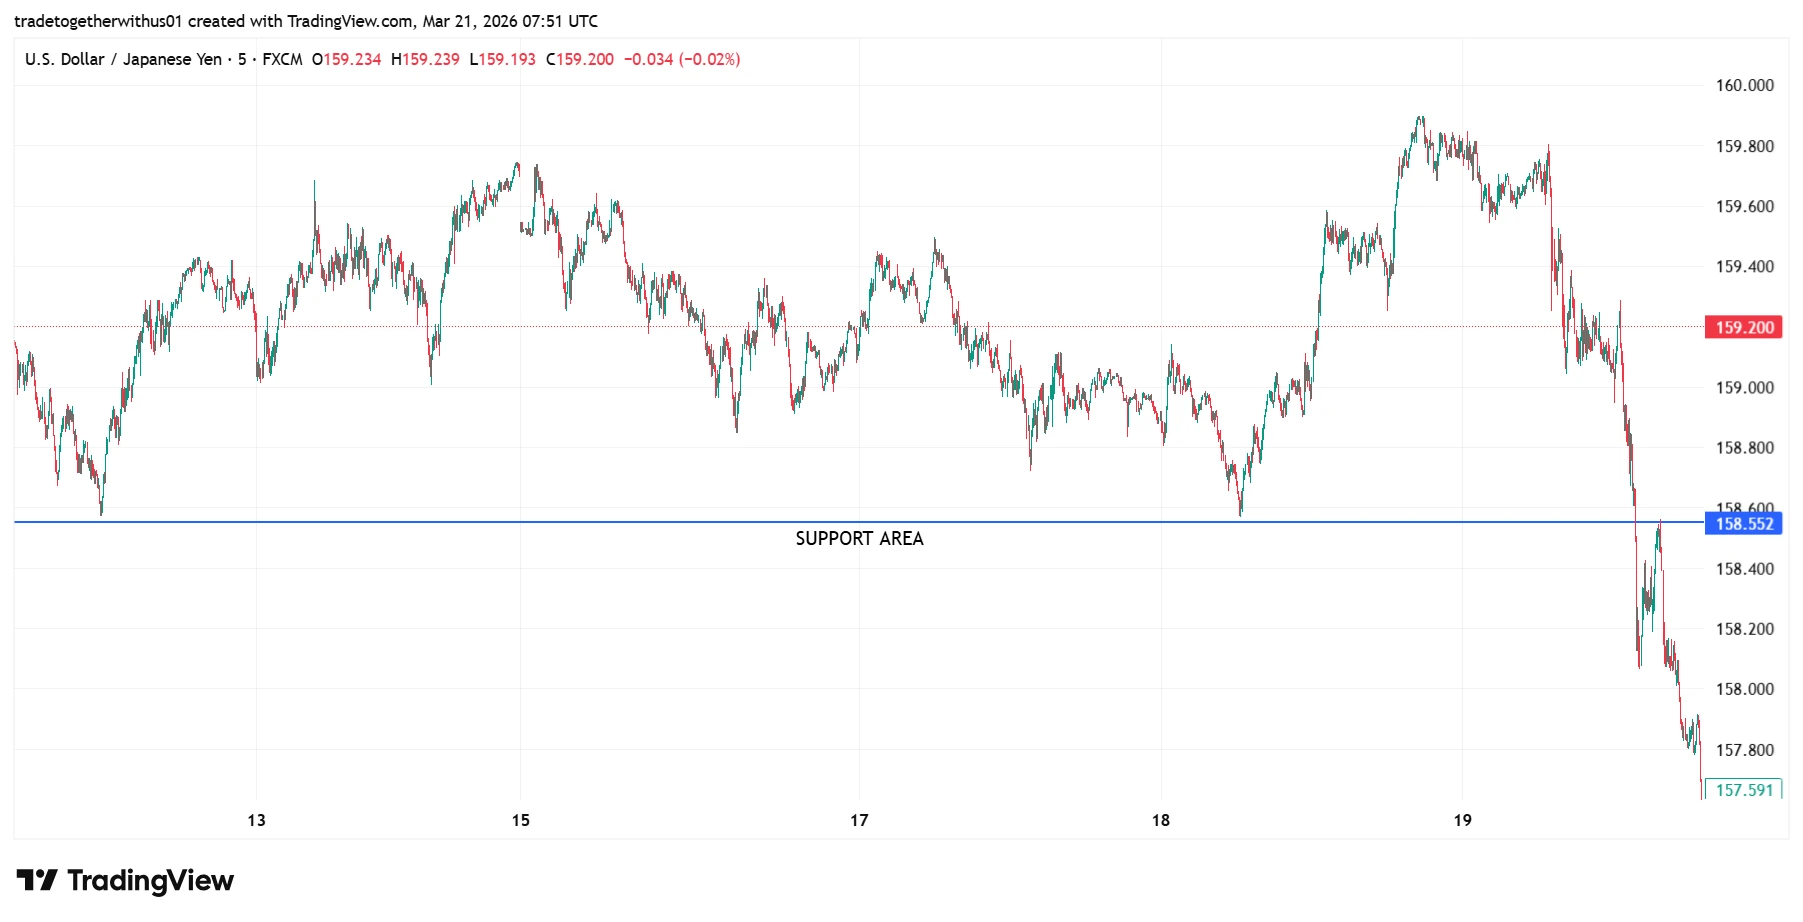
Now when we return to the candlestick chart, we can see the same level clearly.
The 158.552 level has acted as an important support zone where price previously reacted and moved upward.
This behavior matches the concepts we studied in the support and resistance chapter, where broken levels can sometimes change their role from support to resistance or vice versa.
For this example, we mark 158.552 as our key support level and wait for price to return to this area.
Key Learning
- Support and resistance represent areas where buyers and sellers previously reacted.
- These levels often act as decision zones in the market.
- Beginners can use line charts first to identify levels more clearly.
Step 3: Wait for Candlestick Confirmation
After identifying the support level, we do not immediately enter a trade.
Instead, we wait for the market to return to the support area and observe how price reacts there.
When price touches the 158.552 support level, we notice a rejection candle forming near the level.
This candle resembles a hammer pattern, which often indicates that buyers are stepping in after a downward move.
Hammer candles frequently appear near support levels and can signal a potential price rejection or reversal.
However, professional traders rarely rely on a single candle alone.
Therefore, we wait for the next candle to confirm the reaction.
The next candle shows strong bullish pressure, similar to a marubozu-type move pushing upward.
This confirms that buyers are gaining control at the support level.
Key Learning
- Never enter a trade immediately when price touches a level.
- Wait for price confirmation, such as rejection candles.
- Combining trend + support + candlestick confirmation increases trade probability.
Step 4: Trade Entry, Stop Loss and Target
Once confirmation appears, we can plan the trade.
In this example:
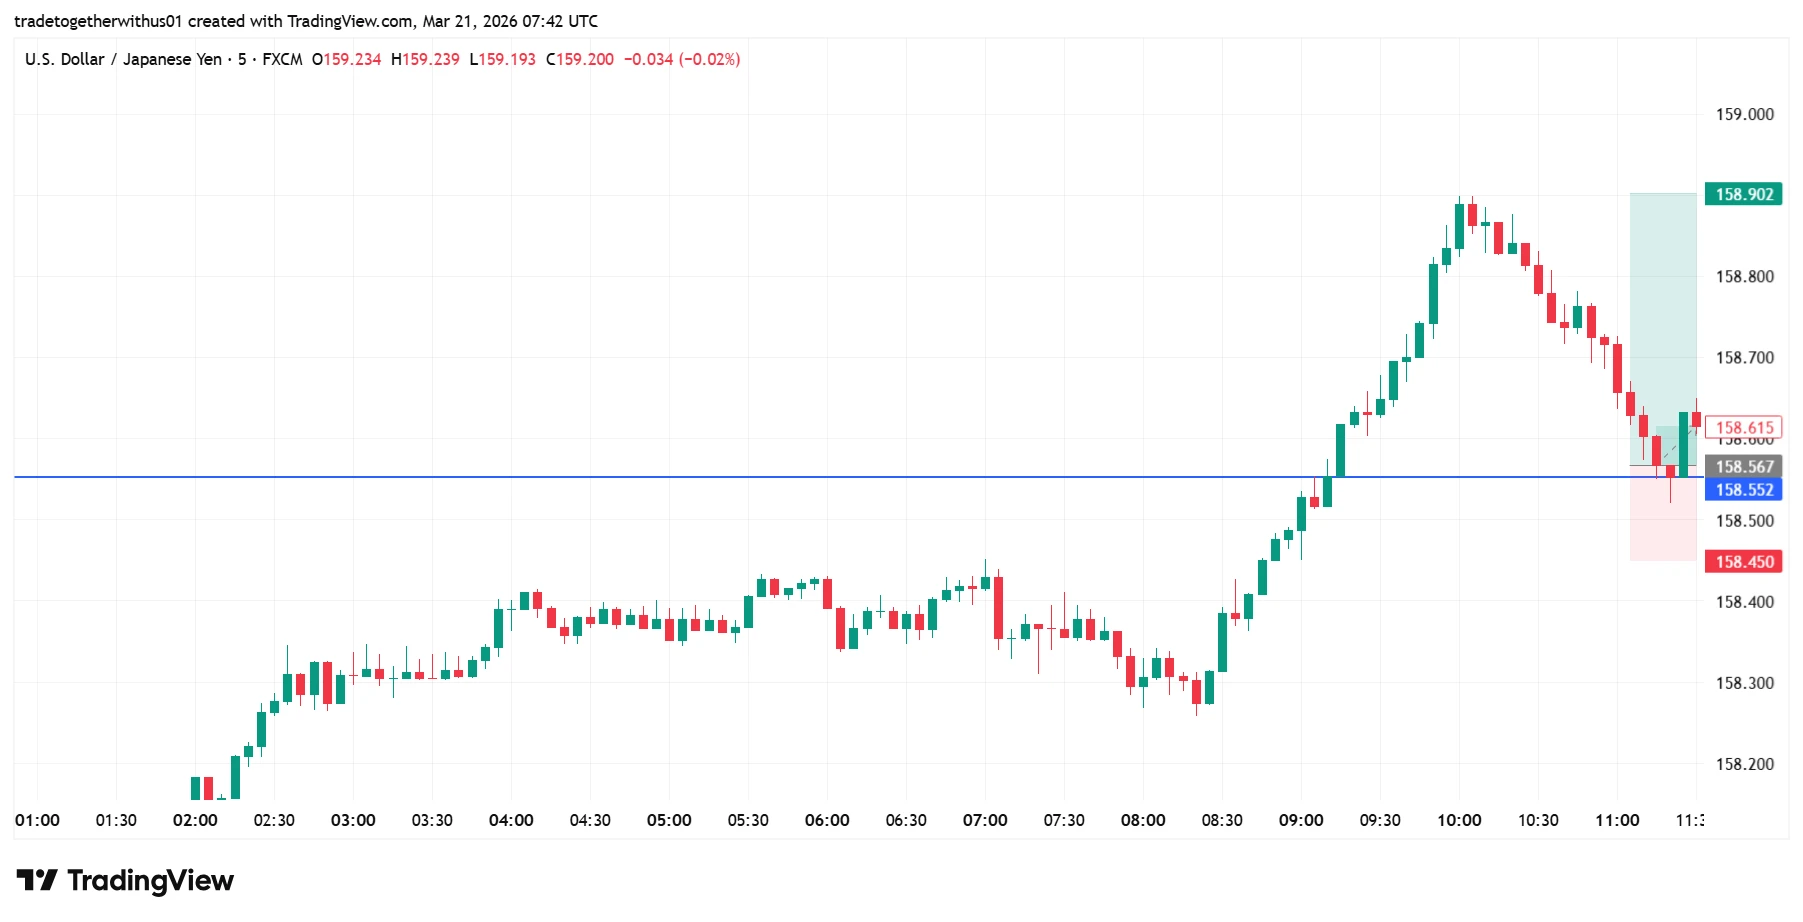
Entry
The entry is placed near the body of the confirmation candle.
Stop Loss
The stop-loss is placed below the rejection candle, giving the trade enough room to breathe if the market fluctuates slightly.
Target
The target is placed near the previous swing high, where price previously faced resistance.
In this example, the setup provides approximately a 1:3 risk-to-reward ratio.
This means that the potential reward is about three times larger than the risk.
Maintaining favorable risk-to-reward ratios is an important part of long-term trading consistency.
Step 5: Trade Outcome
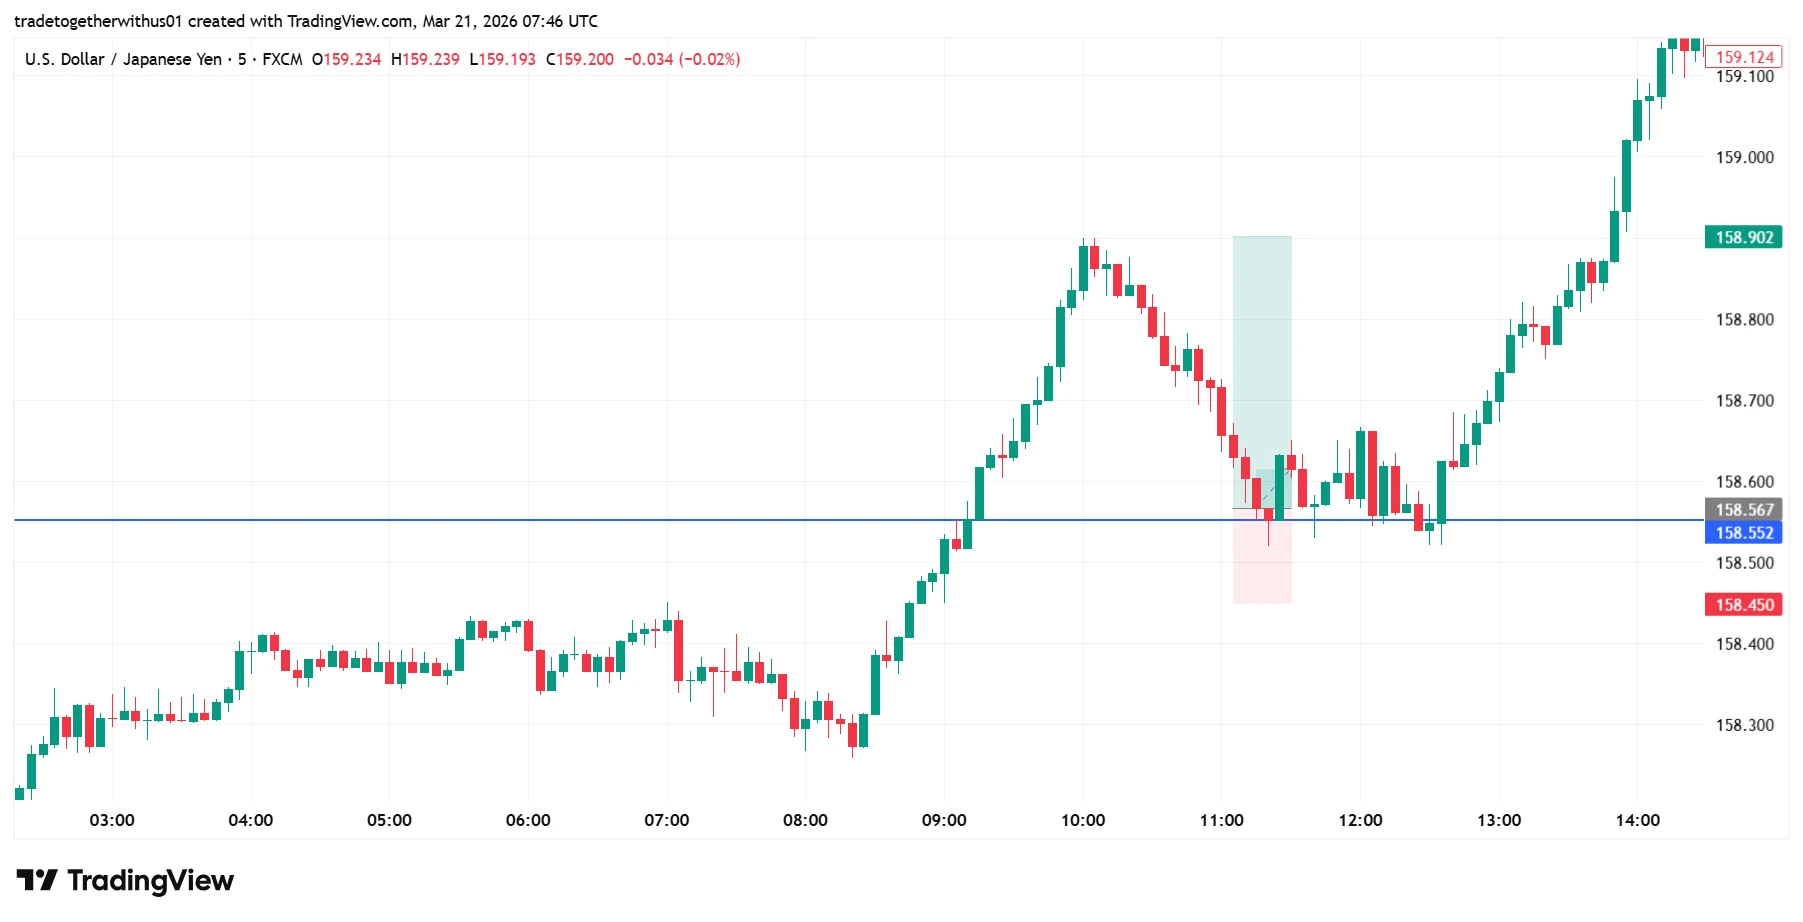
As we continue observing the chart, we can see that the market respected the support level again.
Price moved upward from the support area and eventually reached the projected target.
This results in a successful trade achieving approximately 1:3 risk-to-reward.
However, it is important to understand that not every trade will work like this.
Financial markets are influenced by many factors, including:
- Market sentiment
- Liquidity conditions
- Economic news
- Institutional trading activity
Because of this uncertainty, traders must always manage risk carefully.
Common Beginner Mistakes When Taking Trades
Even when traders understand the basic concepts of trend, support, resistance, and candlestick confirmation, beginners often make several common mistakes.
Understanding these mistakes can improve trading discipline.
Trading Against the Trend
Many beginners attempt to sell in strong uptrends or buy in strong downtrends.
This often leads to lower probability setups because the overall market momentum is moving in the opposite direction.
Entering the Trade Too Early
Another common mistake is entering immediately when price touches support or resistance.
Professional traders usually wait for confirmation signals before entering.
Ignoring Risk Management
Even strong setups can fail. This is why traders always use:
- Stop-loss protection
- Proper position sizing
- Risk-to-reward planning
Risk management helps protect trading capital when markets behave unpredictably.
Important Reminder
This article is intended for educational purposes only.
Financial markets involve risk, and no trading method can guarantee profits. Traders should always practice proper risk management and continue learning before risking real capital.
Conclusion
In this chapter, we combined several concepts we previously studied to understand how a structured trading process works. We learned how to:
- Identify the overall market trend
- Mark important support levels
- Wait for candlestick confirmation
- Plan entry, stop-loss, and target levels
When these elements are combined together, traders can approach the market with a more structured and disciplined method.
In the upcoming chapters, we will explore additional concepts and tools that can help improve trading probability and deepen your understanding of market behavior.

Written by
Trade Together Research
Trade Together Research is a professional market analysis team providing forex, gold, and crypto trading insights, technical analysis, and educational guides.. Learn more about our research team on the About page.