Chapter 20: Chart Patterns in Price Action Trading: Reversal Patterns Explained – Part 2
Sat Apr 18 2026
Introduction
In the previous chapter, we studied the fundamentals of price action trading and how traders analyze raw price movement to understand market behavior.
If you have not read that chapter yet, you can start here: Price Action Trading Explained for Forex Beginners (Chart Reading Guide) – Part 1.
In price action trading, traders often look for patterns in the market to identify potential trading opportunities.
There are mainly two types of patterns traders observe:
- Candlestick patterns
- Chart patterns
We have already explained candlestick patterns in detail in another article. If you want to understand those patterns first, you can read our guide here: Types of Candlesticks in Trading: Marubozu, Doji, Spinning Top and More — And Their Applications (Chapter 8 – Part 2).
In this chapter, we will focus on chart patterns.
There are many chart patterns used in trading, but covering all of them would make the article unnecessarily long and complex. Therefore, we will study some of the most important and commonly observed chart patterns that traders frequently use.
If you have any doubts while reading this article, you can ask your questions in the comment section, and we will try to respond and help clarify your doubts.
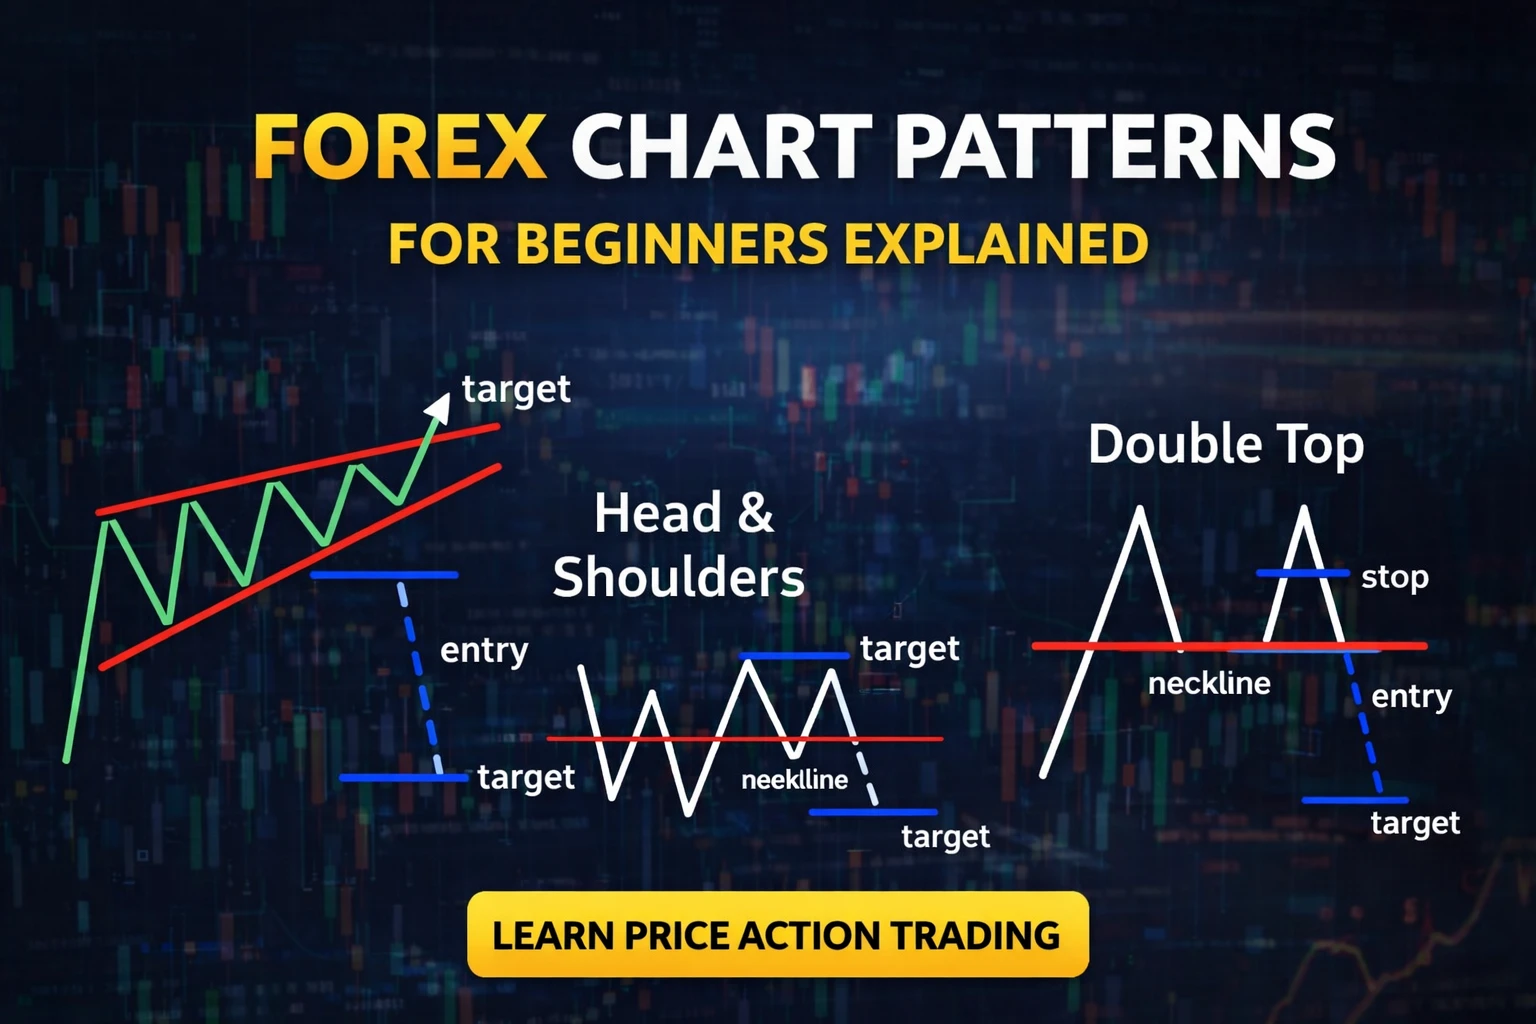
Types of Chart Patterns in Price Action Trading
In price action trading, chart patterns are generally classified into three major categories:
- Bilateral Chart Patterns
- Trend Reversal Chart Patterns
- Trend Continuation Chart Patterns
Each category reflects different market behavior.
Bilateral Chart Patterns
Bilateral patterns are patterns where the market may move in either direction. Traders cannot predict the exact direction before the breakout.
These patterns usually appear during market consolidation, where buyers and sellers are temporarily balanced.
Trend Reversal Chart Patterns
Reversal patterns appear when the current trend starts losing strength and the market may change its direction.
These patterns often appear after strong bullish or bearish trends.
Trend Continuation Chart Patterns
Continuation patterns appear when the market temporarily pauses before continuing in the same direction as the current trend.
Since this article is already covering several patterns, we will study trend continuation chart patterns in the next chapter.
Bilateral Chart Patterns
One of the most common bilateral patterns in price action trading is the triangle pattern.
Triangle Patterns
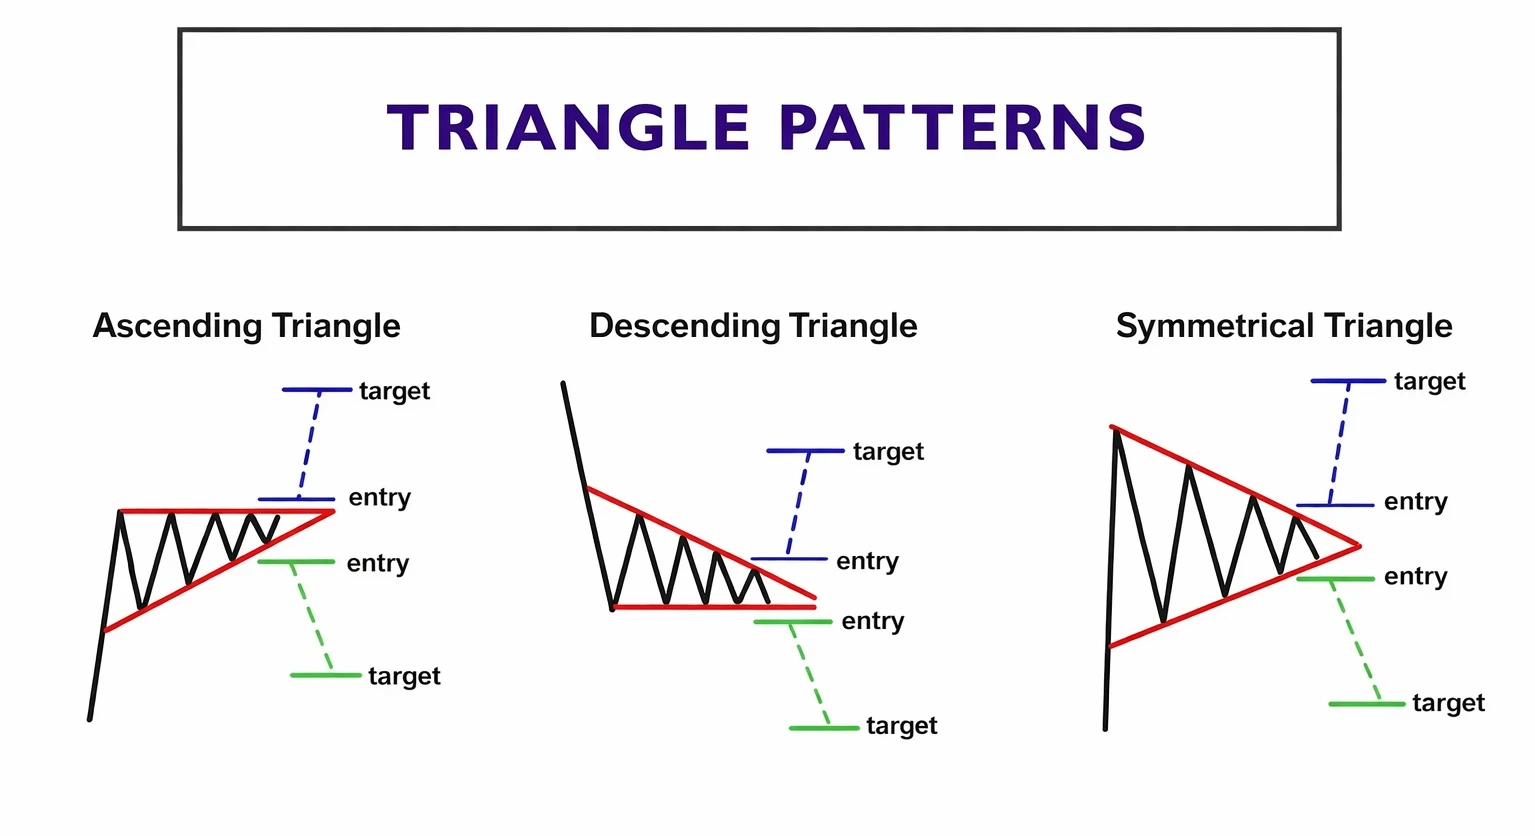
Triangle patterns are formed when the price moves within two converging trendlines.
There are three common types of triangle patterns:
1) Ascending Triangle
An ascending triangle forms when the market creates higher lows while facing resistance at the same level. This pattern often indicates increasing buying pressure.
2) Descending Triangle
A descending triangle forms when the market creates lower highs while support remains at a similar level. This pattern shows that selling pressure is gradually increasing.
3) Symmetrical Triangle
A symmetrical triangle forms when both lower highs and higher lows appear simultaneously. This pattern reflects a period of market consolidation before a breakout.
Since the breakout direction is uncertain before confirmation, triangle patterns are categorized as bilateral patterns.
Trend Reversal Chart Patterns
Reversal chart patterns help traders identify situations where the current trend may change direction.
These patterns often reflect shifts in market psychology, where buyers begin losing momentum and sellers start gaining control.
1) Head and Shoulders Pattern
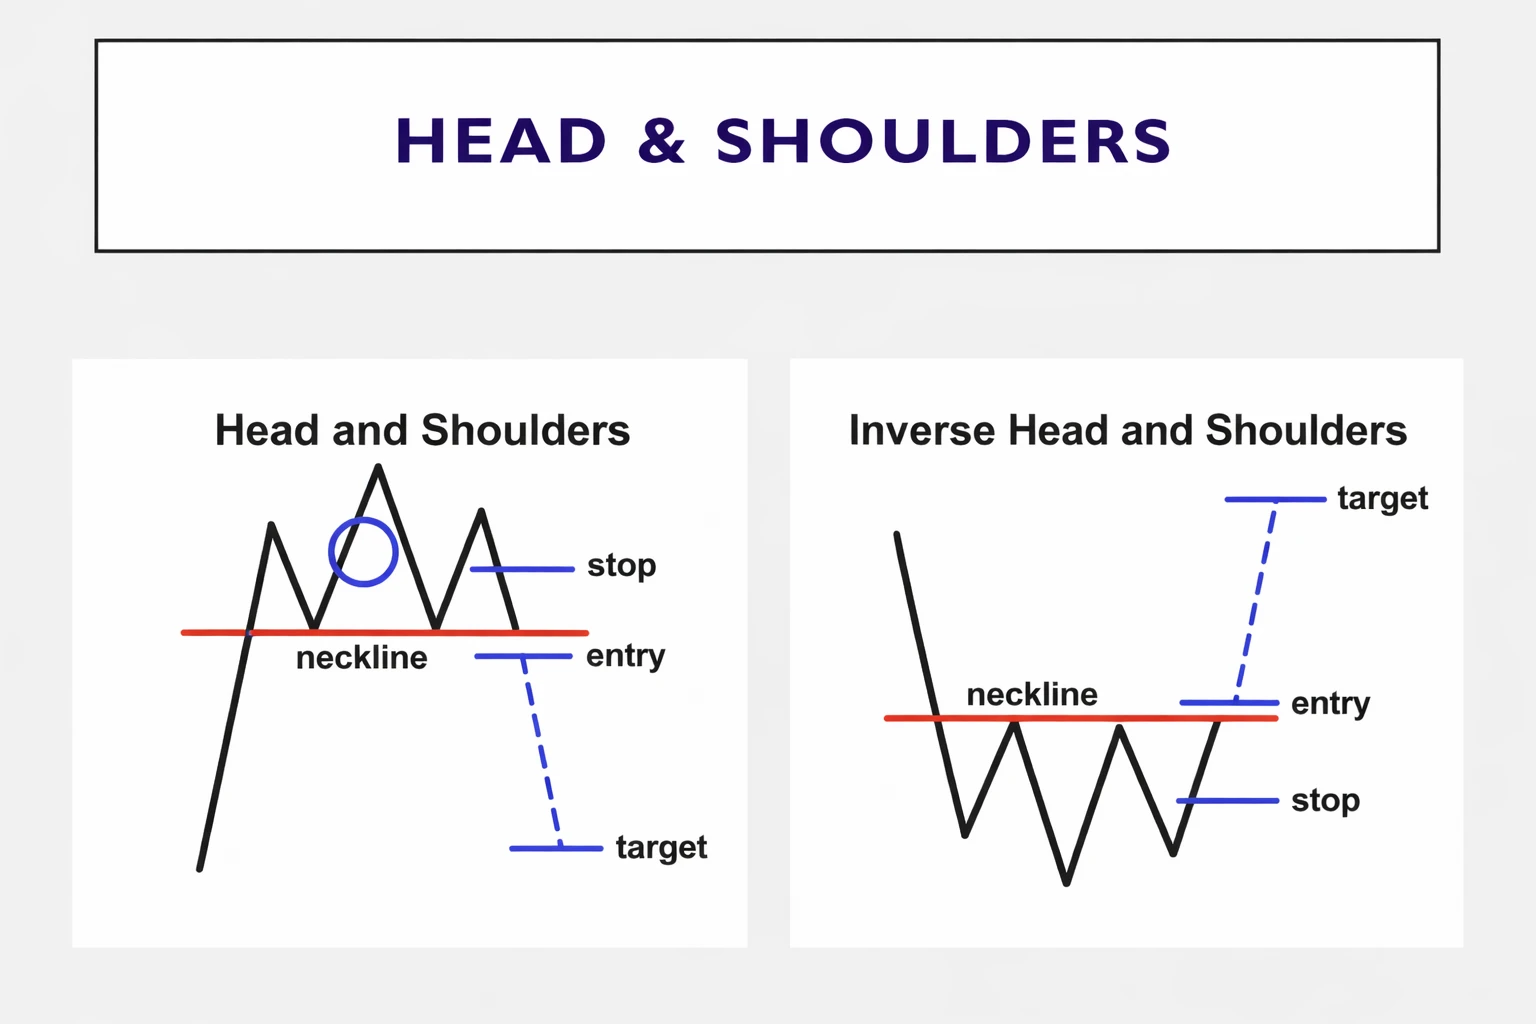
The head and shoulders formation is one of the most recognized trend reversal patterns in technical analysis.
Head and Shoulders
This pattern typically appears after a strong uptrend.
It consists of three peaks:
- Left shoulder
- Head
- Right shoulder
When price breaks below the neckline, it may indicate that buyers are losing strength and the market could start moving downward.
Inverse Head and Shoulders
The inverse head and shoulders pattern is the opposite version of the regular pattern.
It usually appears after a downtrend. Instead of peaks, the pattern forms three troughs.
When the price breaks above the neckline, it may signal that the market could start moving upward.
2) Double Top and Double Bottom Patterns
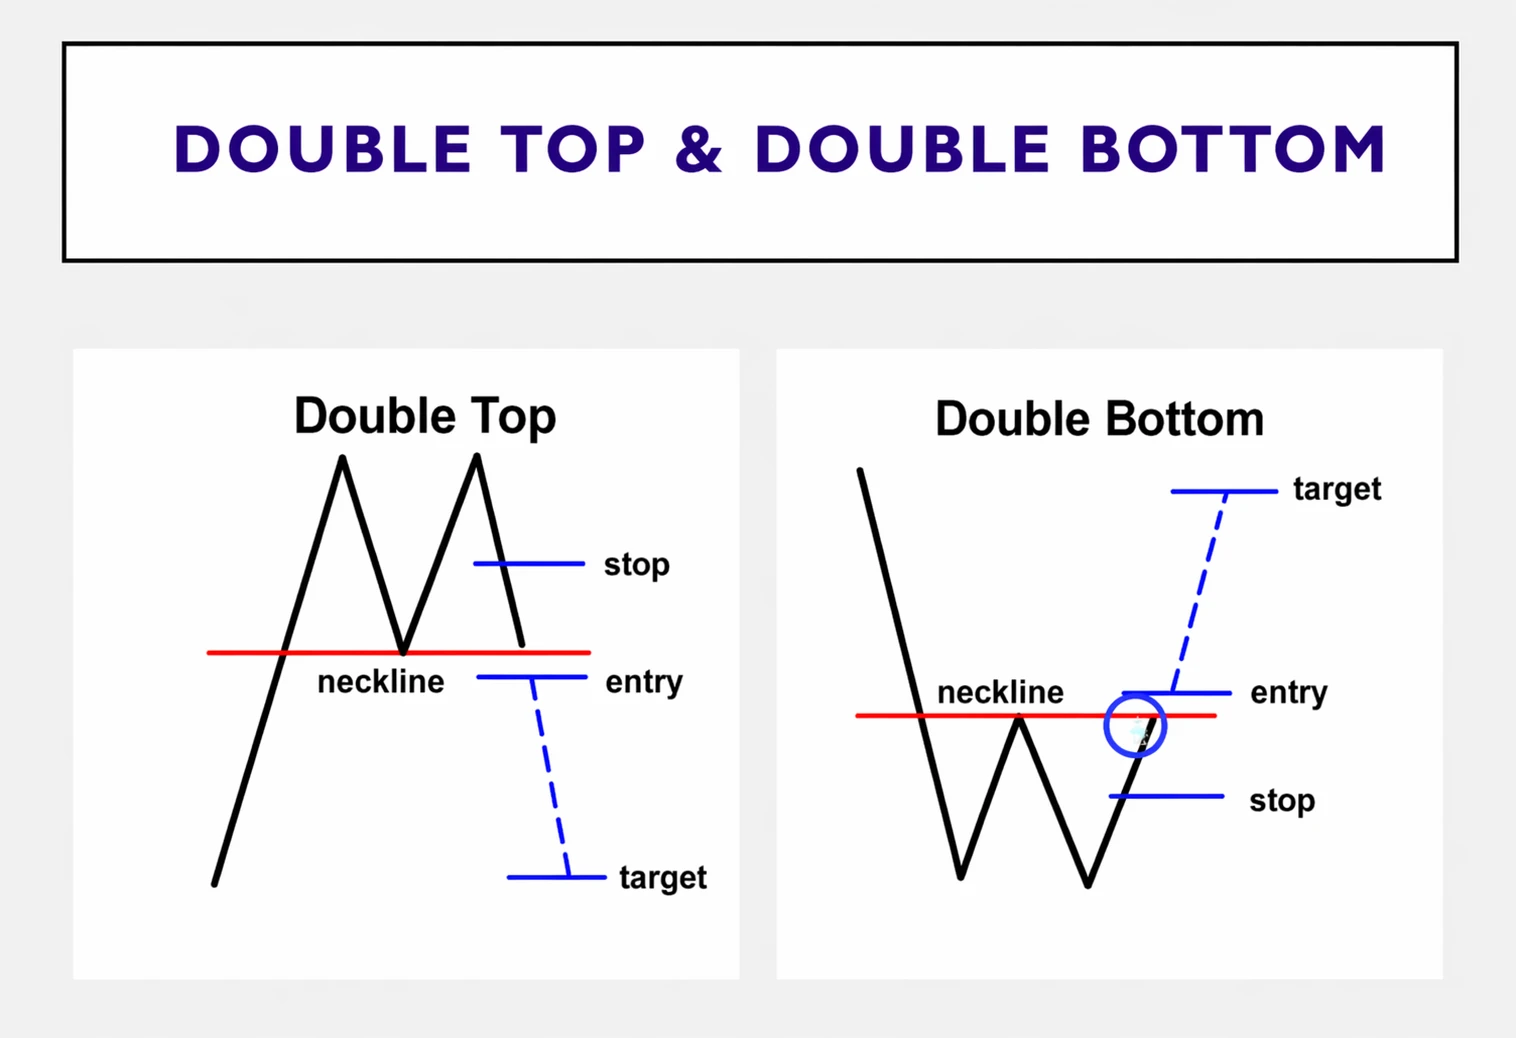
Double patterns are another commonly observed trend reversal structure in financial markets.
Double Top
A double top forms when price tests a resistance level twice but fails to break higher.
This often suggests that buying pressure is weakening and sellers may begin pushing the market downward.
Double Bottom
A double bottom is the opposite pattern.
It forms when price tests a support level twice and fails to move lower.
This may indicate that selling pressure is weakening and buyers may start gaining control.
3) Rising Wedge and Falling Wedge
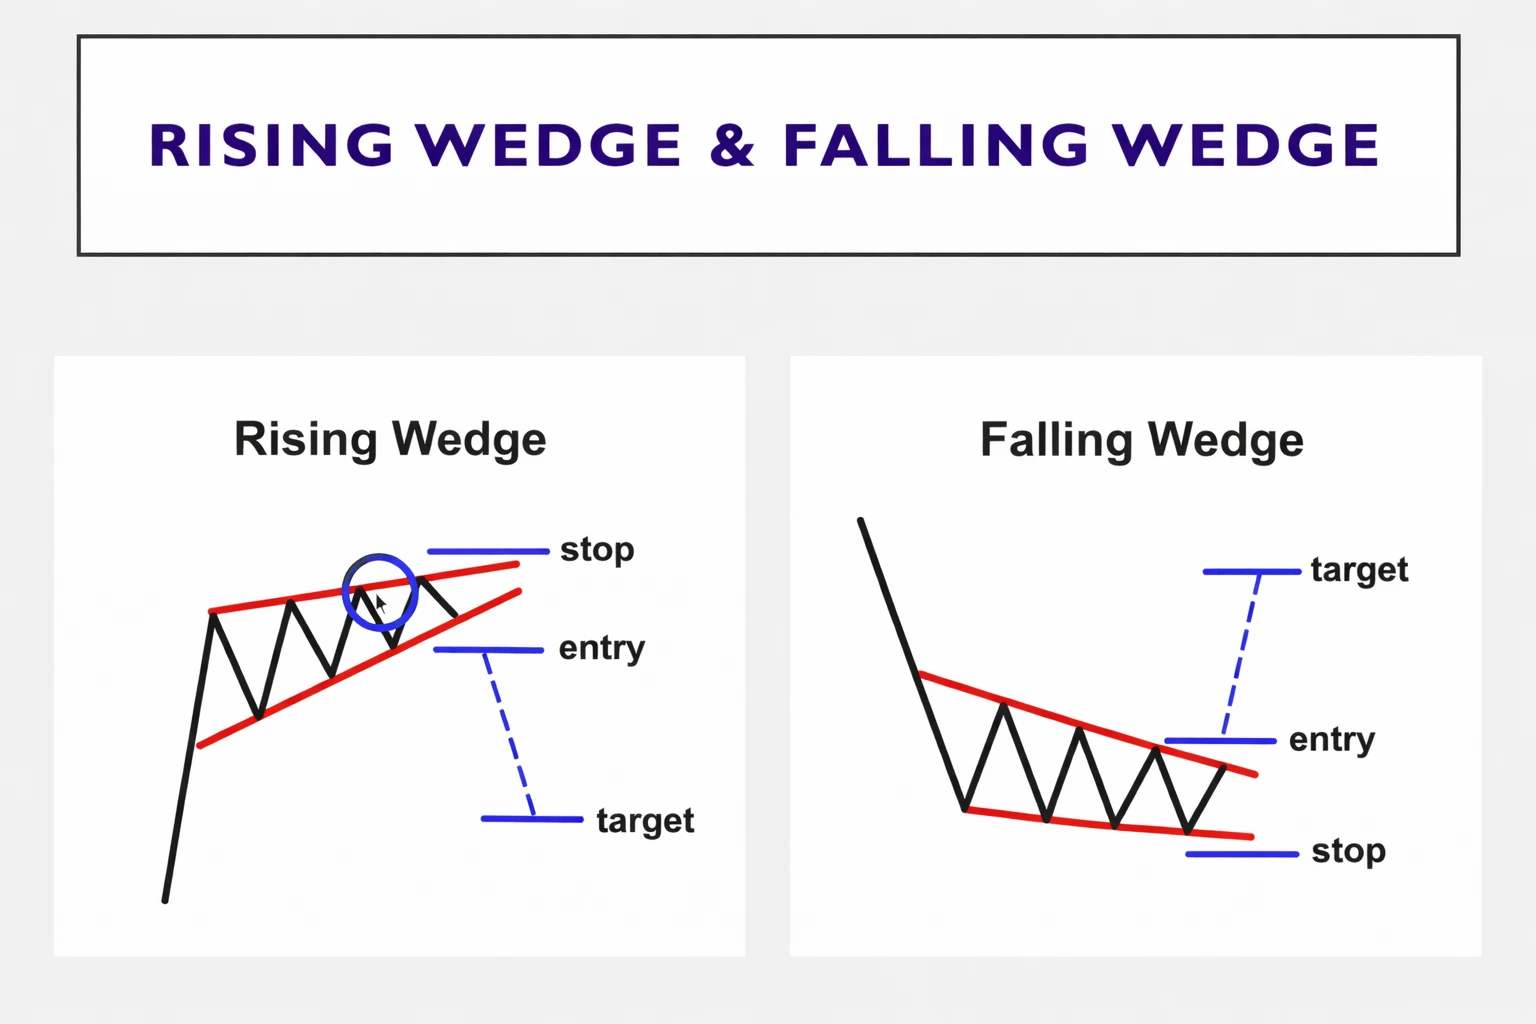
Wedge patterns also often signal potential trend reversals, depending on where they appear.
Rising Wedge
A rising wedge forms when price moves upward inside two converging upward trendlines.
Even though price is moving higher, the structure may indicate weakening buying momentum. This pattern sometimes leads to a downward move after the breakout.
Falling Wedge
A falling wedge forms when price moves downward within two converging downward trendlines.
This structure often indicates weakening selling pressure and may lead to a potential upward breakout.
4) Rounding Bottom Pattern
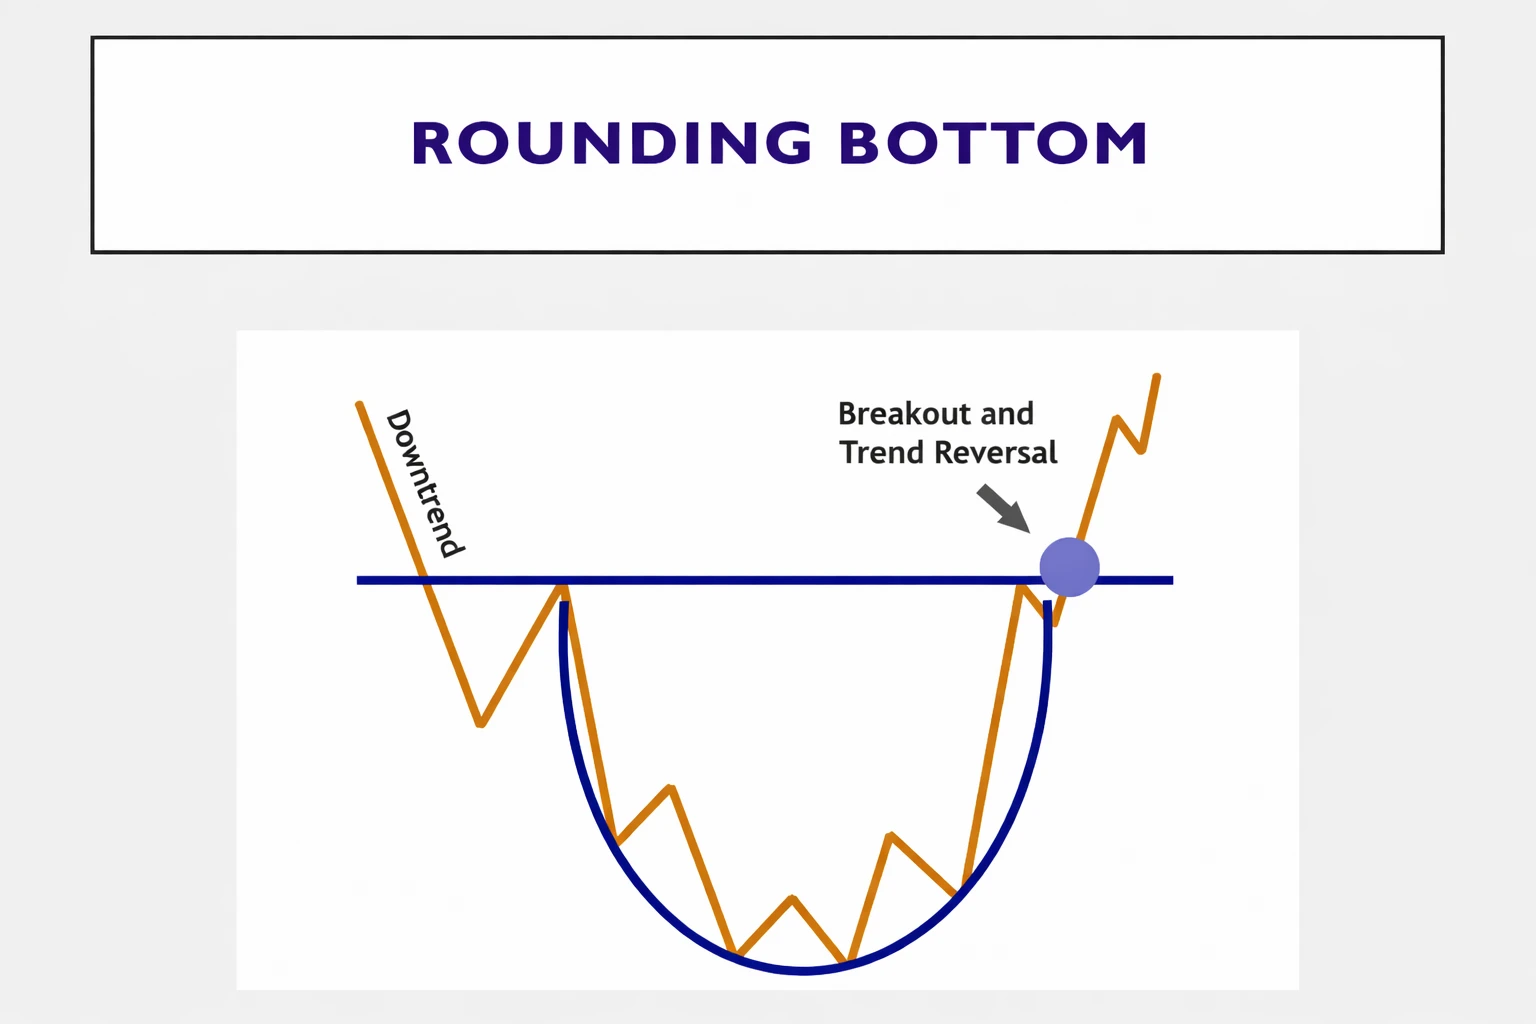
The rounding bottom pattern forms gradually and usually signals a slow transition from a bearish trend to a bullish trend.
Instead of a sharp reversal, the market slowly shifts direction as buying pressure builds over time.
This pattern often appears in longer-term trend reversals.
Practice Identifying Chart Patterns
In this article, we introduced some of the most important chart patterns used in price action trading.
However, learning chart patterns requires practice and observation.
Instead of relying only on theoretical examples, traders should open real charts and try to identify these patterns themselves.
You can consider this as a small exercise or homework while learning price action trading.
If you have any doubts while practicing, feel free to ask in the comment section, and we will try to help you.
Conclusion
Chart patterns are an important part of price action trading because they help traders understand how market sentiment evolves over time.
By studying patterns such as triangles, head and shoulders, double tops, and wedges, traders can gain deeper insights into potential market behavior.
However, it is important to remember that no chart pattern guarantees a specific market outcome. Financial markets are influenced by liquidity, macroeconomic events, and trader psychology.
For this reason, traders should always combine pattern analysis with risk management and disciplined decision making.
This article is provided for educational purposes only and should not be considered financial advice.
In the next chapter, we will study trend continuation chart patterns, which help traders identify situations where an existing trend may continue.
Frequently Asked Questions
What are chart patterns in forex trading?
Chart patterns are recognizable price formations that appear on trading charts. Traders study them to understand potential market behavior.
Are chart patterns reliable?
Chart patterns can provide insights into market structure, but they do not guarantee outcomes. They should always be used with proper risk management.
What is the difference between candlestick patterns and chart patterns?
Candlestick patterns analyze one or a few candles, while chart patterns analyze broader price structures formed over longer periods.
Should beginners learn chart patterns?
Yes. Learning chart patterns helps beginners understand market psychology and price movement more clearly.

Written by
Trade Together Research
Trade Together Research is a professional market analysis team providing forex, gold, and crypto trading insights, technical analysis, and educational guides.. Learn more about our research team on the About page.